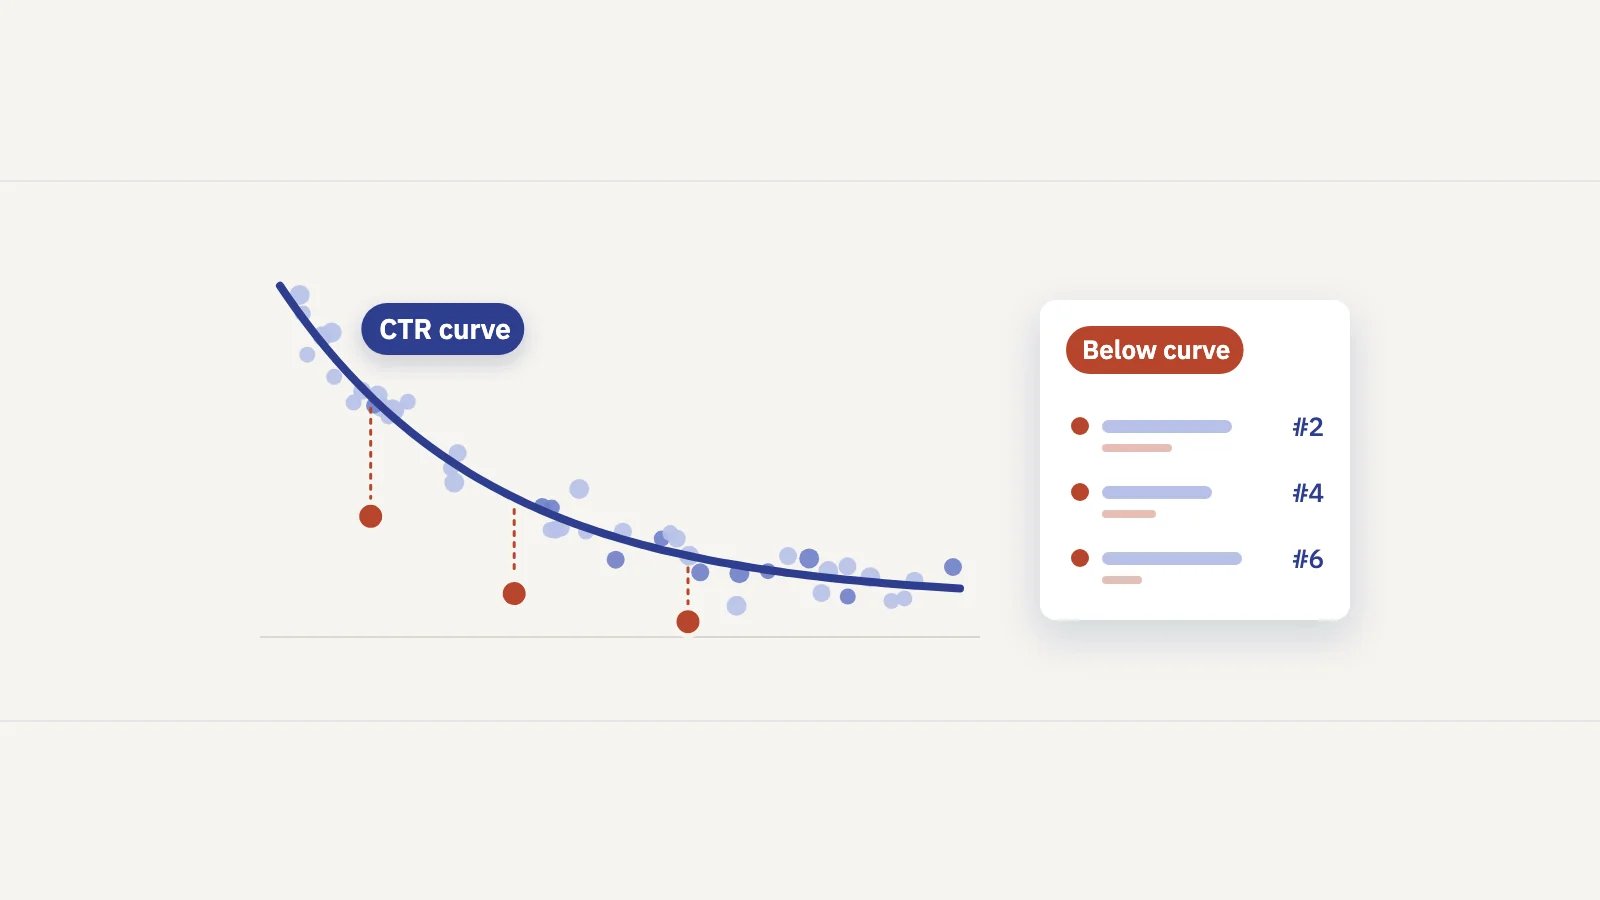
There is no single good CTR. A good click-through rate is one at or above what your own pages earn at the same position, for the same kind of query, and you can build that benchmark from your Search Console data in an afternoon.
Why a single "good CTR" number is meaningless
Google defines click-through rate as clicks divided by impressions (Search Console metrics help). That one ratio blends several things that have little to do with how good your result is. A 3% CTR can be excellent for one query and a problem for another.
| Factor | How it moves CTR |
|---|---|
| Position | The biggest factor. CTR falls steeply from position 1 to 3 and keeps falling down the page. |
| Intent | A "buy" or "near me" query gets clicked. A query with a short factual answer often doesn't, because the results page answers it. |
| Brand | People searching your brand name want your site. Brand queries get far higher CTR than non-brand queries at the same position. |
| SERP features | Ads, shopping units, video and image blocks, "People also ask" and featured snippets all take attention above or around your result. |
| AI Overviews | An AI Overview occupies a single position in Search Console, and every link inside it shares that position (same Google page). A result below one can rank "3" and sit far down the screen. |
| Device | Mobile and desktop show different layouts, so the same position gets a different share of attention. |
| Country and language | Results pages differ by market, and so does CTR. |
So a benchmark copied from someone else's site, or an average across an industry, is measuring their mix of positions, intents, brand share and SERP layouts. Even your own site-wide CTR mostly reflects your mix: publish content that ranks on page two for hundreds of new queries and site CTR falls while clicks rise. (The same trap applies to position; see how average position misleads.)
The useful question isn't "is my CTR good?" It's "is this query clicked as often as my other queries at the same position?"
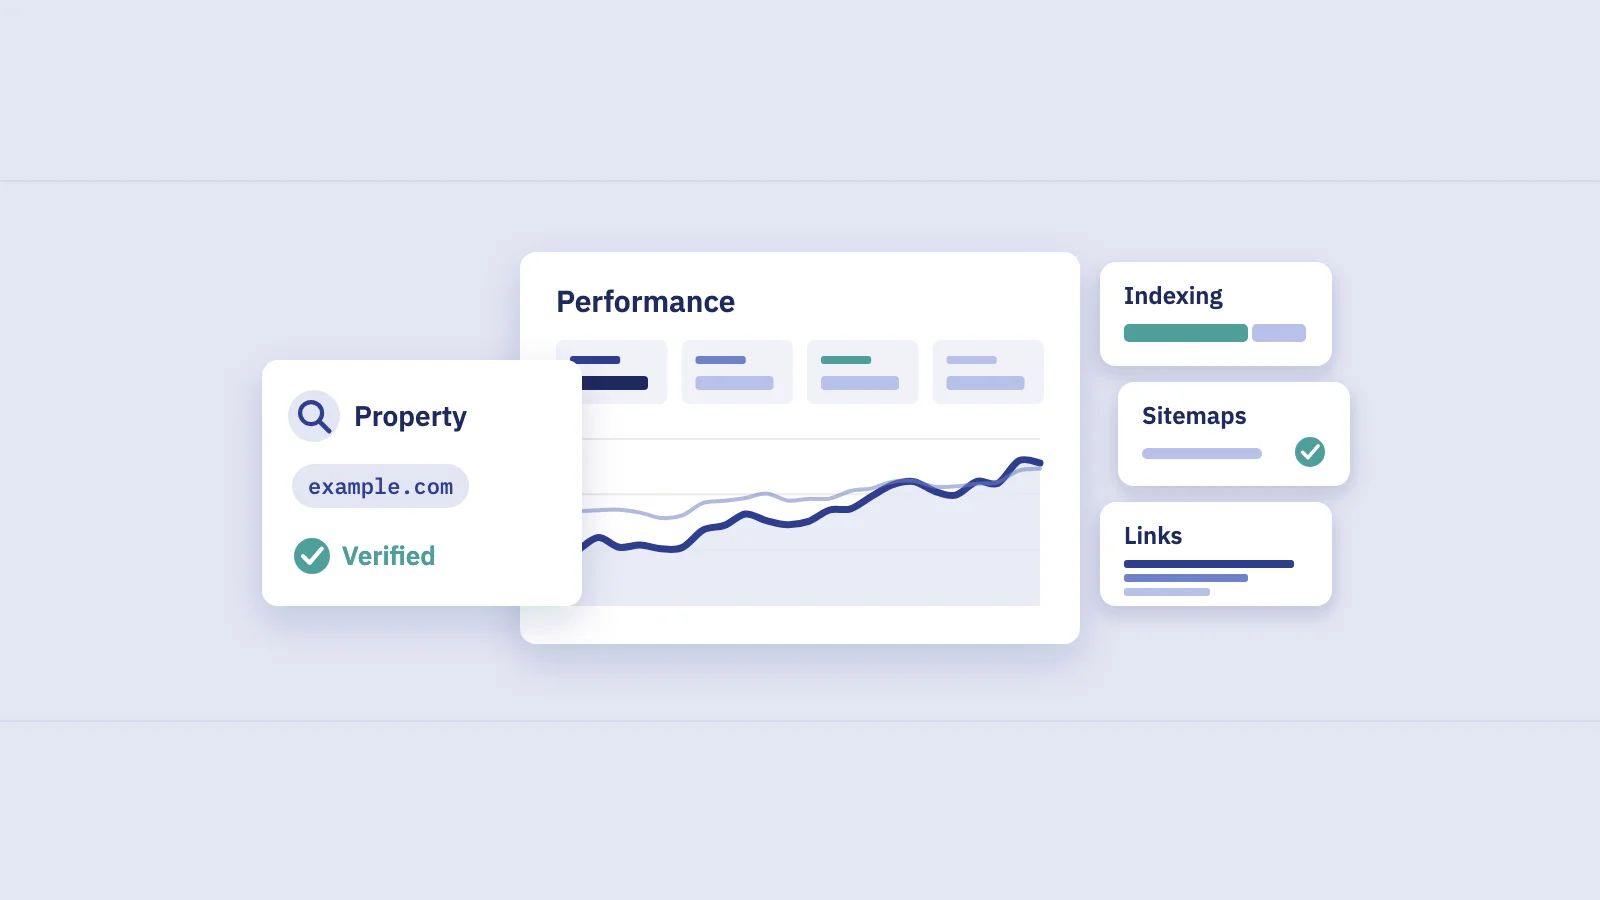
Build your own CTR curve in Search Console
A CTR curve is your typical CTR at each position, built from your own queries. It already reflects your brand strength, your niche's results pages and your snippets, which is what makes it a fair benchmark.
- Open Performance > Search results. Turn on the Average CTR and Average position tiles. Keep the search type on Web.
- Pick a period. Three months is usually enough data while staying mostly inside one season. Avoid a window that contains a big Google update or a site migration.
- Remove brand queries. Use the branded queries filter if your property has it (Google's help on branded queries; it isn't offered for sites with few impressions), or add a Query filter with Custom (regex) that doesn't match your brand terms. Our guide to Search Console regex has patterns for that.
- Split by device if mobile and desktop differ. Add a Device filter via + Add filter and build one curve per device.
- Export the Queries table. The UI export stops at 1,000 rows and leaves out anonymized queries, so on a large site use the Search Console API, the bulk data export to BigQuery, or Looker Studio to get every row.
- Keep queries with enough data. Drop queries with only a handful of impressions over the period (under 100 is a sensible cut for most sites) and anything beyond position 20.
- Group by position and take the median. Put each query in a bucket (1, 2, 3, 4–5, 6–7, 8–10, 11–20, by its average position) and take the median CTR of the queries in each bucket. If a bucket has fewer than about 10 queries, merge it with its neighbour.
The result is a short table like this:
| Position bucket | Queries | Median CTR | Impression-weighted CTR |
|---|---|---|---|
| 1 | 42 | 26.5% | 31.0% |
| 2 | 38 | 15.0% | 17.2% |
| 3 | 51 | 10.4% | 9.1% |
| 4–5 | 96 | 6.6% | 7.0% |
| 6–7 | 88 | 4.1% | 3.6% |
| 8–10 | 120 | 2.6% | 2.2% |
| 11–20 | 310 | 0.8% | 0.6% |
Example data.
Median or impression-weighted?
The impression-weighted CTR (total clicks ÷ total impressions per bucket) is dominated by your biggest queries: one query with 50,000 impressions can set the whole bucket. The median treats each query as one vote, so it describes a typical query better. Use the median as the curve, and look at the weighted number to see whether a few big queries behave differently.
A note on "stable position"
Each query's position is itself an average over impressions, so a query at 3.0 may have been at 1 on some days and at 6 on others. Before you trust a query's place on the curve, check that its position held: use Date > Compare to put the two halves of your period side by side, and keep queries whose position moved by less than one place.
How to spot underperformers
An underperformer is a query whose CTR is well below your curve at a stable position. "Well below" needs a threshold, or every query under the median gets flagged. A practical rule:
- CTR under 70% of the curve's value at that position,
- and at least one percentage point below it, so low-CTR positions don't flag tiny differences,
- with enough impressions to trust the number (50 or more in the period at minimum),
- and a position that held within one place across the period.
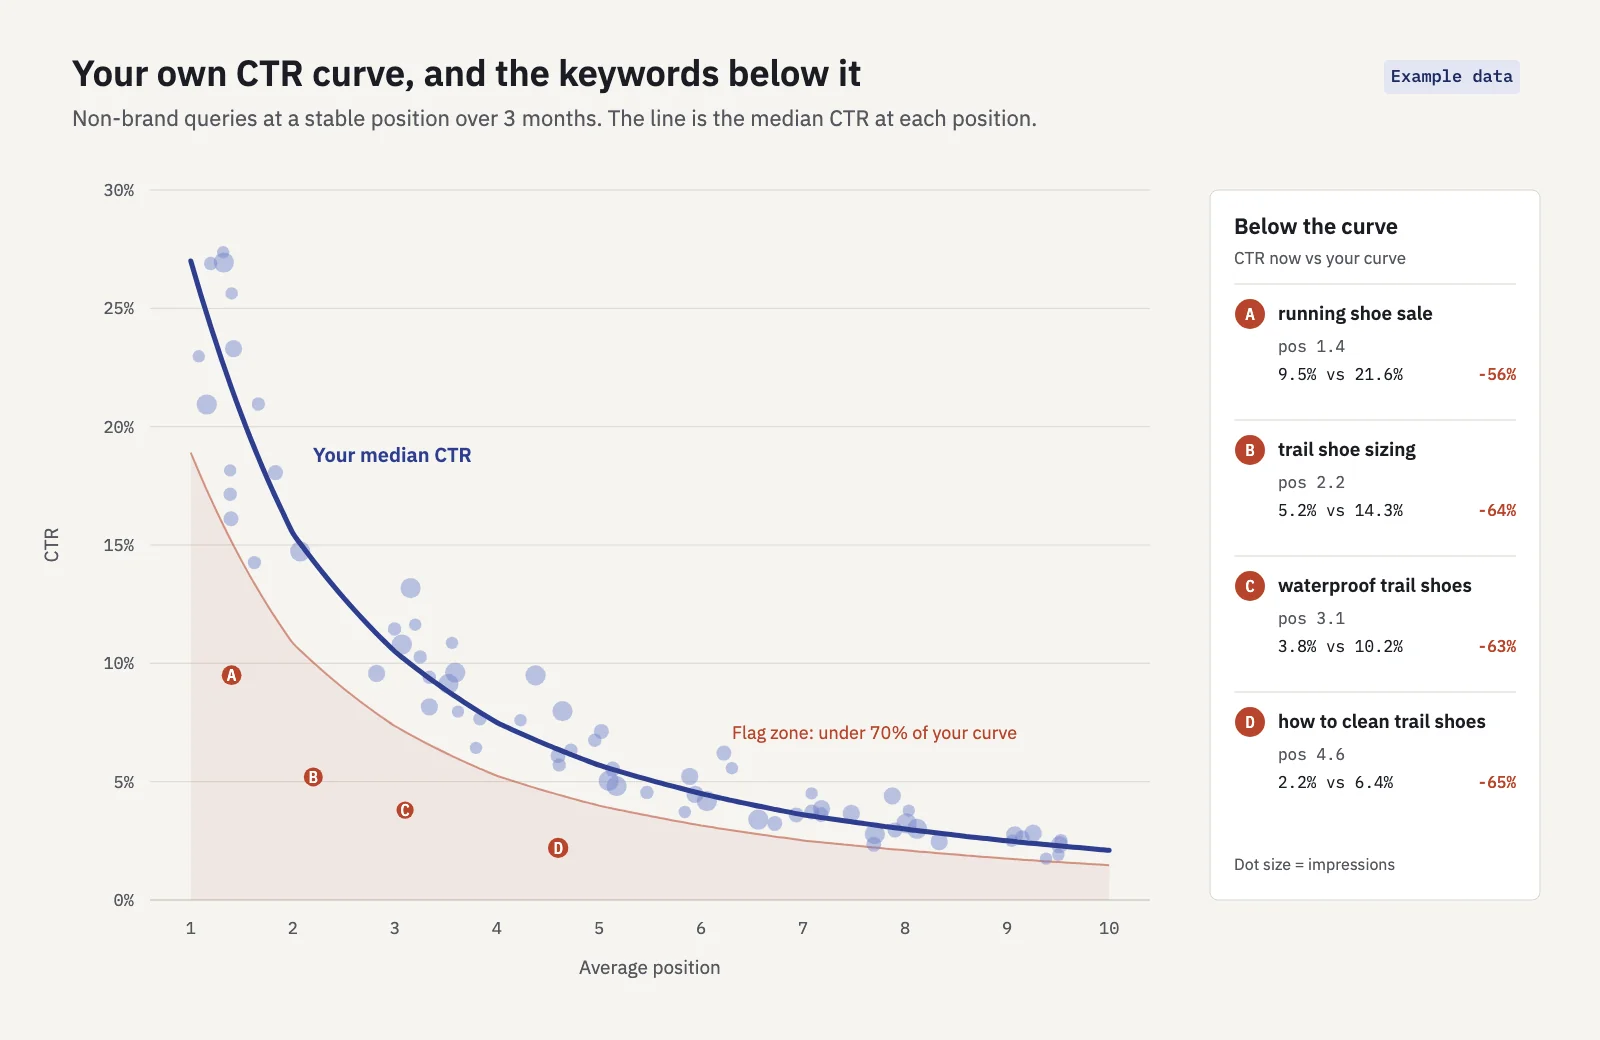 Example data. Four queries sit in the flag zone, 56% to 65% under the curve.
Then sort the flagged queries by what they could be worth. A simple estimate of clicks at stake is (curve CTR − actual CTR) × impressions. Say a query sits at position 2.2 with 6,000 impressions a month and a 5.2% CTR, while your curve says 14.3% at that position. The gap is 9.1 points, or about 550 clicks a month. You won't close all of it, so count on half as a planning number: roughly 270 clicks a month from one snippet.
Watch for the same problem over time, too. A query that keeps a top-3 position while its CTR falls by a quarter or more against the previous period has the same symptom, only newly arrived. That is often a new SERP feature above the result, such as an AI Overview; our guide to AI search visibility covers how to read that in Search Console.
Serplyze runs both checks on your tracked keywords. Its Content findings include a CTR gap check: a keyword in the top 10 with at least 50 impressions is flagged when its CTR is under 70% of the expected CTR and at least one point below it. The expected CTR starts from a generic curve and is scaled to how your own non-brand tracked keywords are clicked at that position (or by the keyword's group, when the group has enough keywords). Traffic's CTR drop at top view lists queries at position 3 or better in both periods, moved by at most one place, with 100+ impressions in each, whose CTR fell by 25% or more.
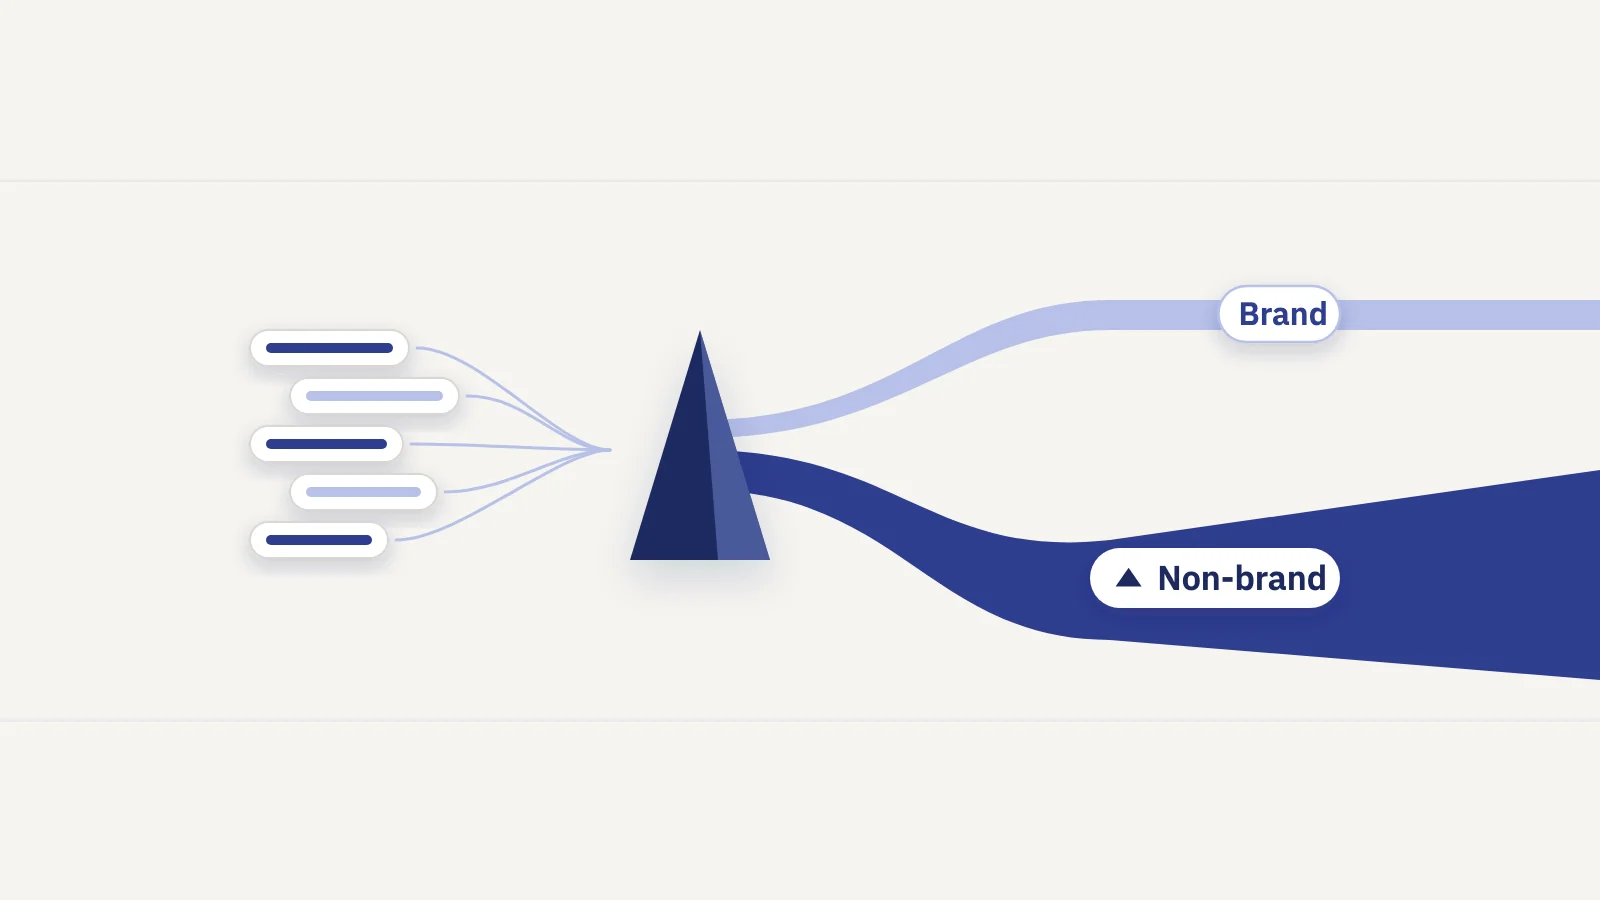
Brand and non-brand need separate curves
If you skip step 3, your curve is wrong for most of your queries. Brand queries are clicked far more often at every position, because the searcher already chose you. Mixed into one curve, they lift the benchmark, and ordinary non-brand queries look like underperformers.
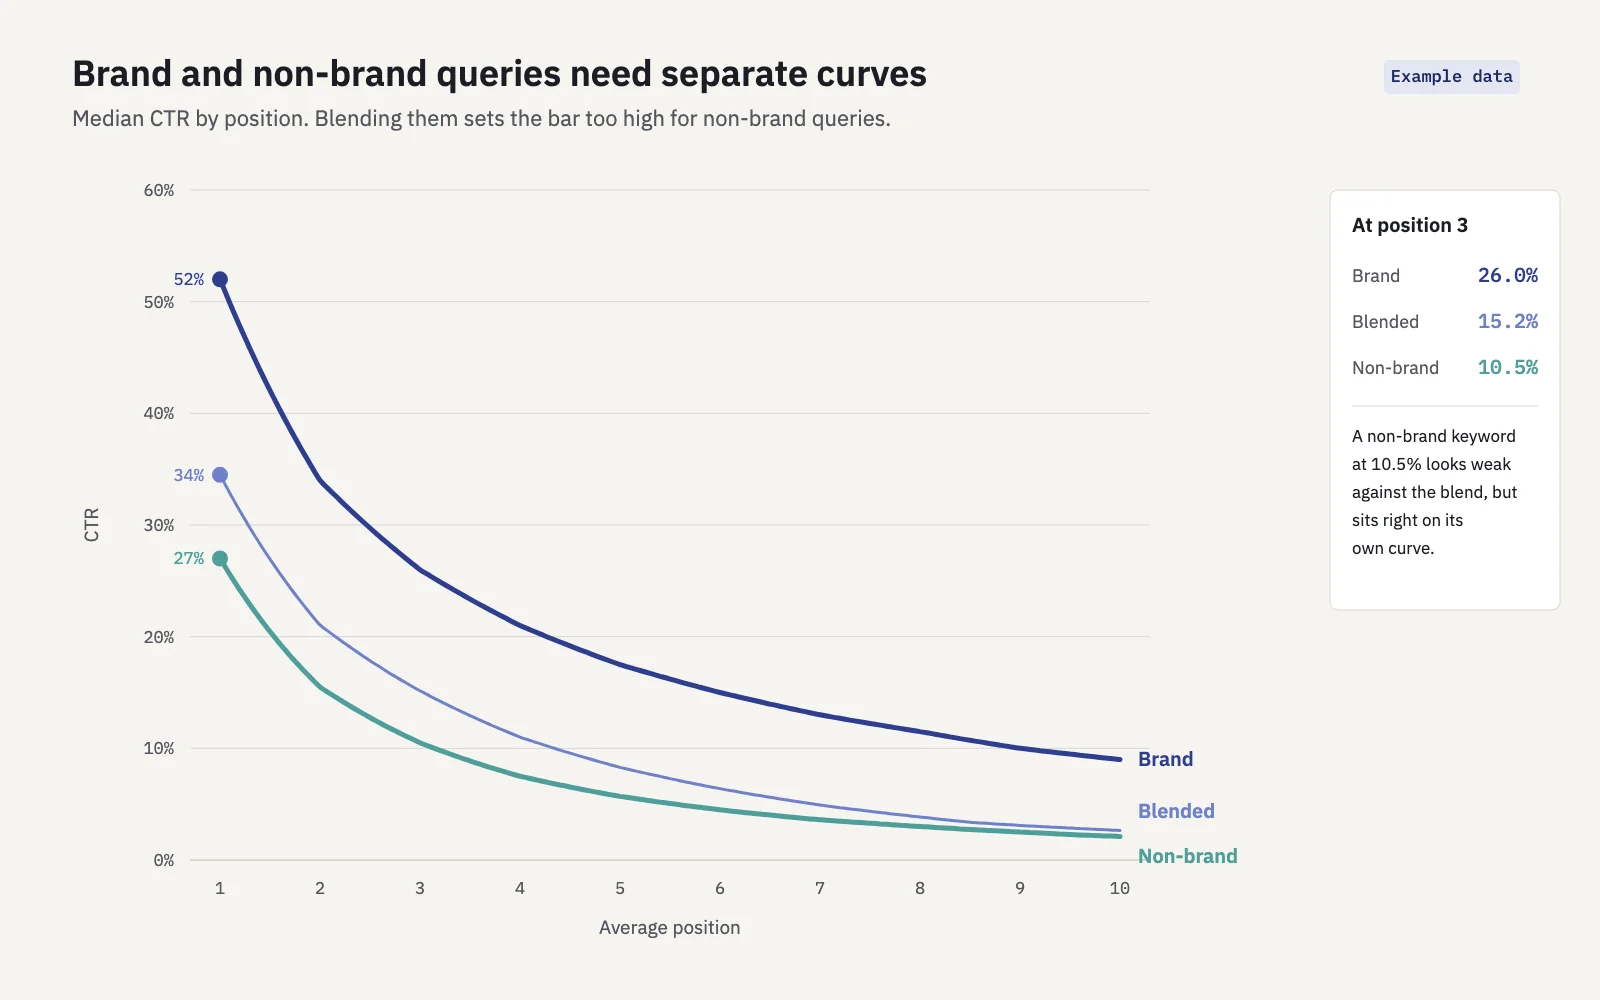 Example data. Against the blend, a typical non-brand query looks about 30% short.
The same logic applies to other groups that behave differently. Question-style queries with a short answer, local queries with a map pack and product queries with shopping units each have their own results page layout. If one group of keywords is clicked consistently lower, give it its own curve rather than flagging every keyword in it. Our guide to branded vs non-branded traffic covers how to split the two reliably, and keyword clustering covers building topic groups.
Why a query sits below its curve
Before you rewrite anything, find out why. Search the query yourself (signed out, on the device and in the country that matters) and look at the whole results page, then check these causes in order.
| Cause | How to check | What to do |
|---|---|---|
| Snippet doesn't match the query | Compare your title and description with what the searcher typed and with the results around you | Rewrite the title and meta description for the query you rank for |
| SERP features above you | Ads, AI Overview, shopping, video or "People also ask" push you down the screen | Accept a lower curve for that group, or target the feature (video, structured data) |
| Intent mismatch | The top results are a different page type (tool, list, product page) than yours | Build or point to the page type searchers want |
| The wrong page ranks | In the Pages tab for that query, a weaker URL of yours shows up | Consolidate or relink; see keyword cannibalization |
| A rich result was lost | Search appearance in Compare mode shows review snippets or product results dropping | Fix the structured data that produced them |
| Device or country mix | CTR differs sharply with a Device or Country filter | Fix the weak segment, often the mobile title truncating |
| Seasonality or news | The query spikes in impressions at a time of year or after an event | Wait it out and compare with the same period last year |
What to do about underperformers
Work the list from the top, one change at a time:
- Start with the largest clicks at stake among queries whose cause you've identified.
- Change the snippet first when the cause is the snippet. Titles and descriptions are the cheapest change and the quickest to show up. Our guide to meta descriptions that lift CTR covers writing them and testing them.
- Write down the date and the page. Without a log, you won't remember three months later which change did what.
- Measure before vs after with equal windows. Compare the same number of days before and after the change, wait for Google to recrawl the page, and set the result against your site's overall CTR in the same weeks so a seasonal swing isn't credited to the rewrite.
- Rebuild your curve every quarter. As your rankings, SERP layouts and brand strength change, so does the benchmark.
Some queries will stay below the curve whatever you do, because the results page answers them. For those, impressions are the outcome you can still influence; read zero-click searches for how to report them honestly.
Key takeaways
- CTR depends on position, intent, brand, SERP features, AI Overviews and device, so a single "good CTR" number tells you little.
- Build your own curve: non-brand queries, three months, median CTR per position bucket, per device when they differ.
- Flag queries under about 70% of the curve at a stable position, with enough impressions, and sort by clicks at stake.
- Keep brand and non-brand on separate curves, and give answer-style query groups their own.
- Diagnose the cause before rewriting, change one thing at a time, and measure against the site's trend.
Serplyze builds the expected CTR from your own tracked keywords and lists the CTR gaps with the clicks at stake, from your Search Console data. Start free and see which of your keywords sit below your curve.