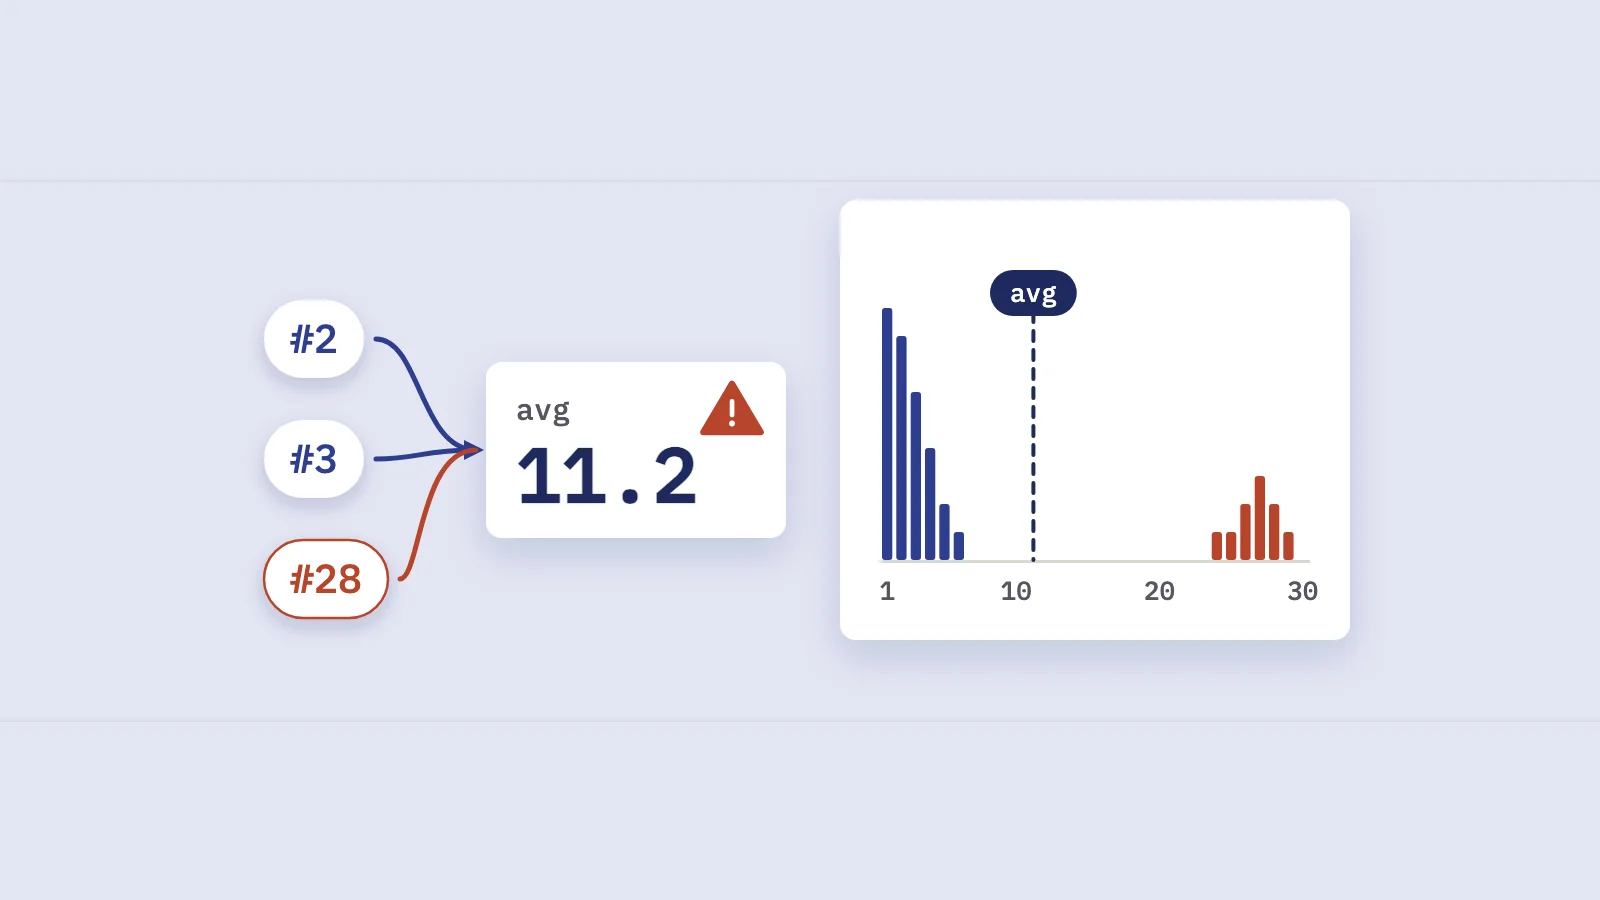
Average position in Search Console is an average of one number per impression: the highest spot your site held on that results page. That makes it easy to compute and easy to misread, because it moves when the mix of searches changes, not only when your rankings do.
How Google calculates average position
Google's explanation of Search Console metrics defines position as the topmost position occupied by a link to your property (or page) in the search results. Two rules follow from that:
- Only the topmost link counts. If your site shows up at positions 2, 4 and 6 for one search, that impression is recorded as position 2. The other two links add nothing.
- No impression, no position. If a searcher never saw your result (say it sat on page three and nobody went there), nothing is recorded for that search. A query with no impressions shows a dash, not a bad number.
The report then averages those recorded values across impressions. Google's bulk data export documentation makes the weighting explicit: each row stores the sum of the topmost position "for each impression", and you get average position by dividing that sum by impressions and adding 1 (the stored values are zero-based). A query with 5,000 impressions moves the average 100 times more than a query with 50.
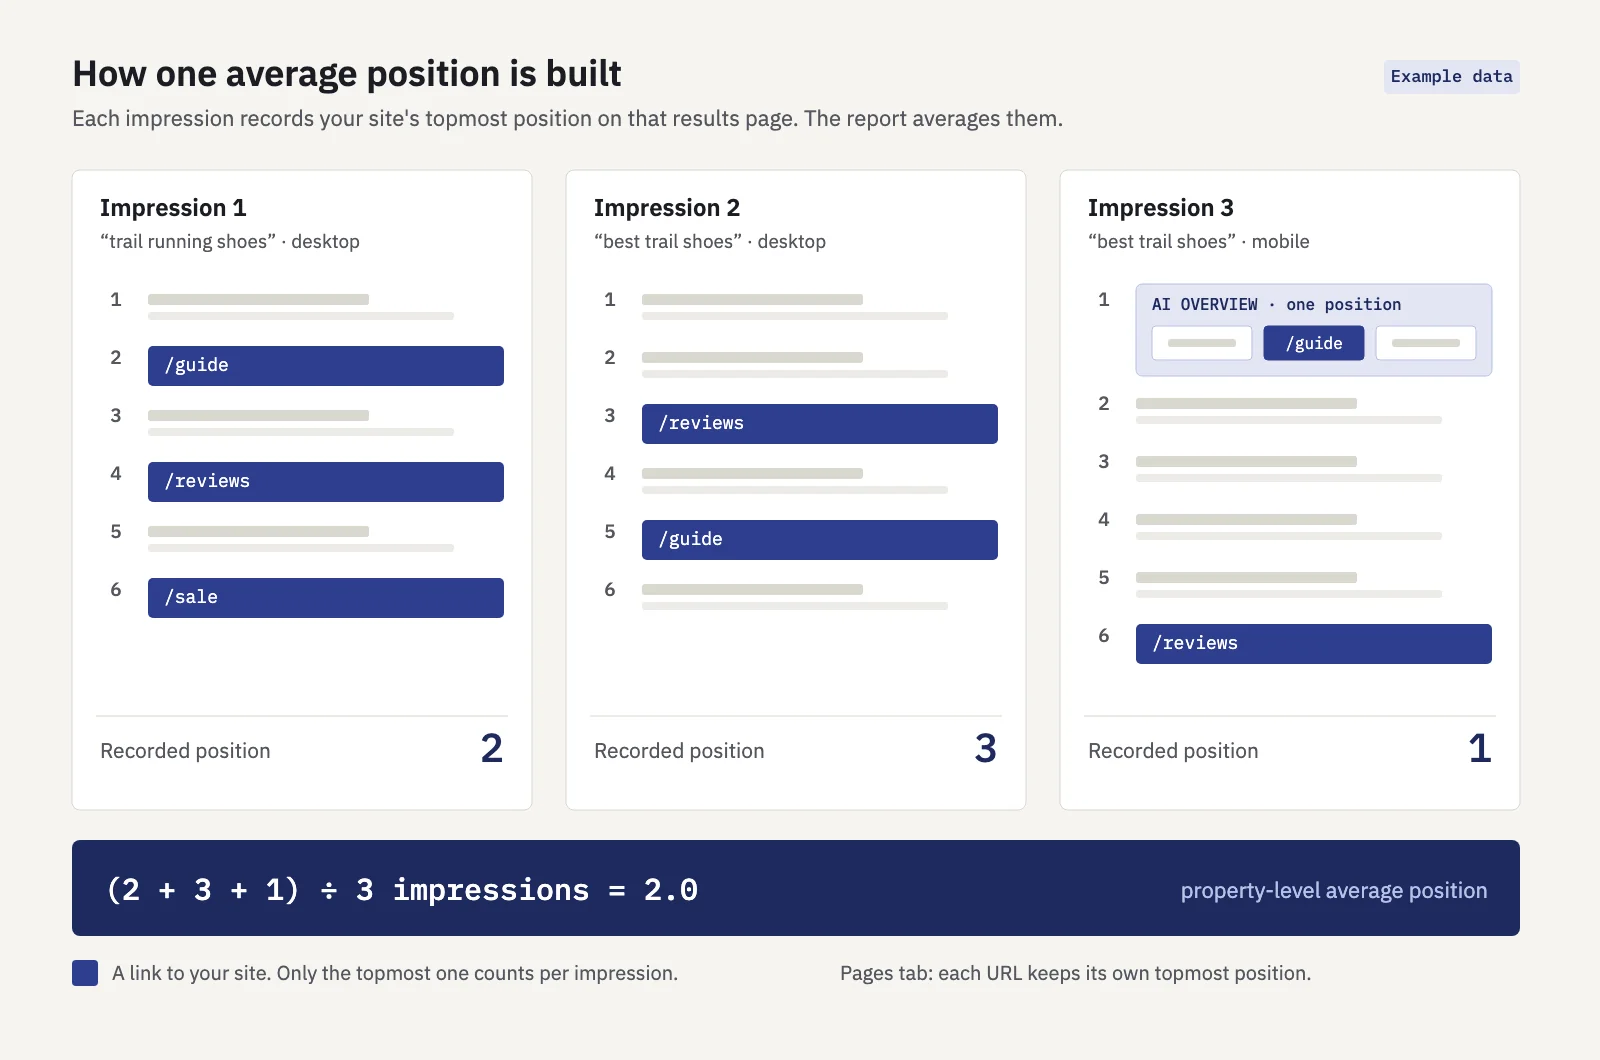 Example data. One recorded position per impression, averaged.
How search features are counted
Each element on the results page takes a single position, however many links it holds. The details by result type, from the same Google page:
| Result type | How position is assigned |
|---|---|
| AI Overview | Occupies one position; every link inside it gets that position |
| AI Mode | Same methodology as a regular results page |
| Featured snippet | Normal rules; the snippet's source link typically takes position 1 |
| Carousel | The carousel takes one position; all its items share it |
| Knowledge panel | One position for the whole panel, which can be a high number even though the panel is prominent |
| Image search | Counted left to right, then top to bottom, so it varies with screen width |
| Ads | Don't occupy a position |
| Discover | No position recorded |
Positions are generally counted from top to bottom on the main column, then on the side column. So "position 7" can be a knowledge panel on the right, a result below a carousel, or a row of images. A number that looks bad can be a prominent placement, and a good one can sit below an AI Overview that answered the question.
Property vs page: why the chart and table disagree
The Performance report help states that data on the chart is aggregated by property, while the table's Pages and Search appearance views are aggregated by page. For average position that means:
- The chart shows the average of the topmost result from your entire site. Two of your URLs on the same results page count once, at the higher spot.
- The Pages table gives each URL its own topmost position. In the first impression in the figure above, /guide gets 2, /reviews gets 4 and /sale gets 6.
Google notes that chart totals can differ from table totals for this reason. If you export the Pages table and average the rows, you will not get the chart number, and you shouldn't expect to. Averaging exported rows has a second problem: each row counts once, whatever its impressions, so a page seen 20 times weighs as much as one seen 20,000 times.
Why average position misleads
The average answers "where, on average, was my best link when someone saw it?" That is a question about the impressions you received, so anything that changes which impressions you receive changes the number.
New queries drag it down while traffic grows
This is the most common false alarm. A site publishes new content, starts appearing for hundreds of queries at positions 20 to 40, and the property-level average falls off a cliff while clicks go up.
Say a site gets 2,500 impressions a week from queries it already ranks well for, at an average position of 4.0. Over 16 weeks those queries improve slightly, to 3.5, and their clicks go from 200 to 225. Meanwhile, new pages start collecting 3,750 impressions a week at around position 28, with about 38 clicks.
Every part of the site did as well as before or better. But the combined average is (2,500 × 3.5 + 3,750 × 28) ÷ 6,250 = 18.2. The chart says position went from 4.0 to 18.2; clicks rose 31%.
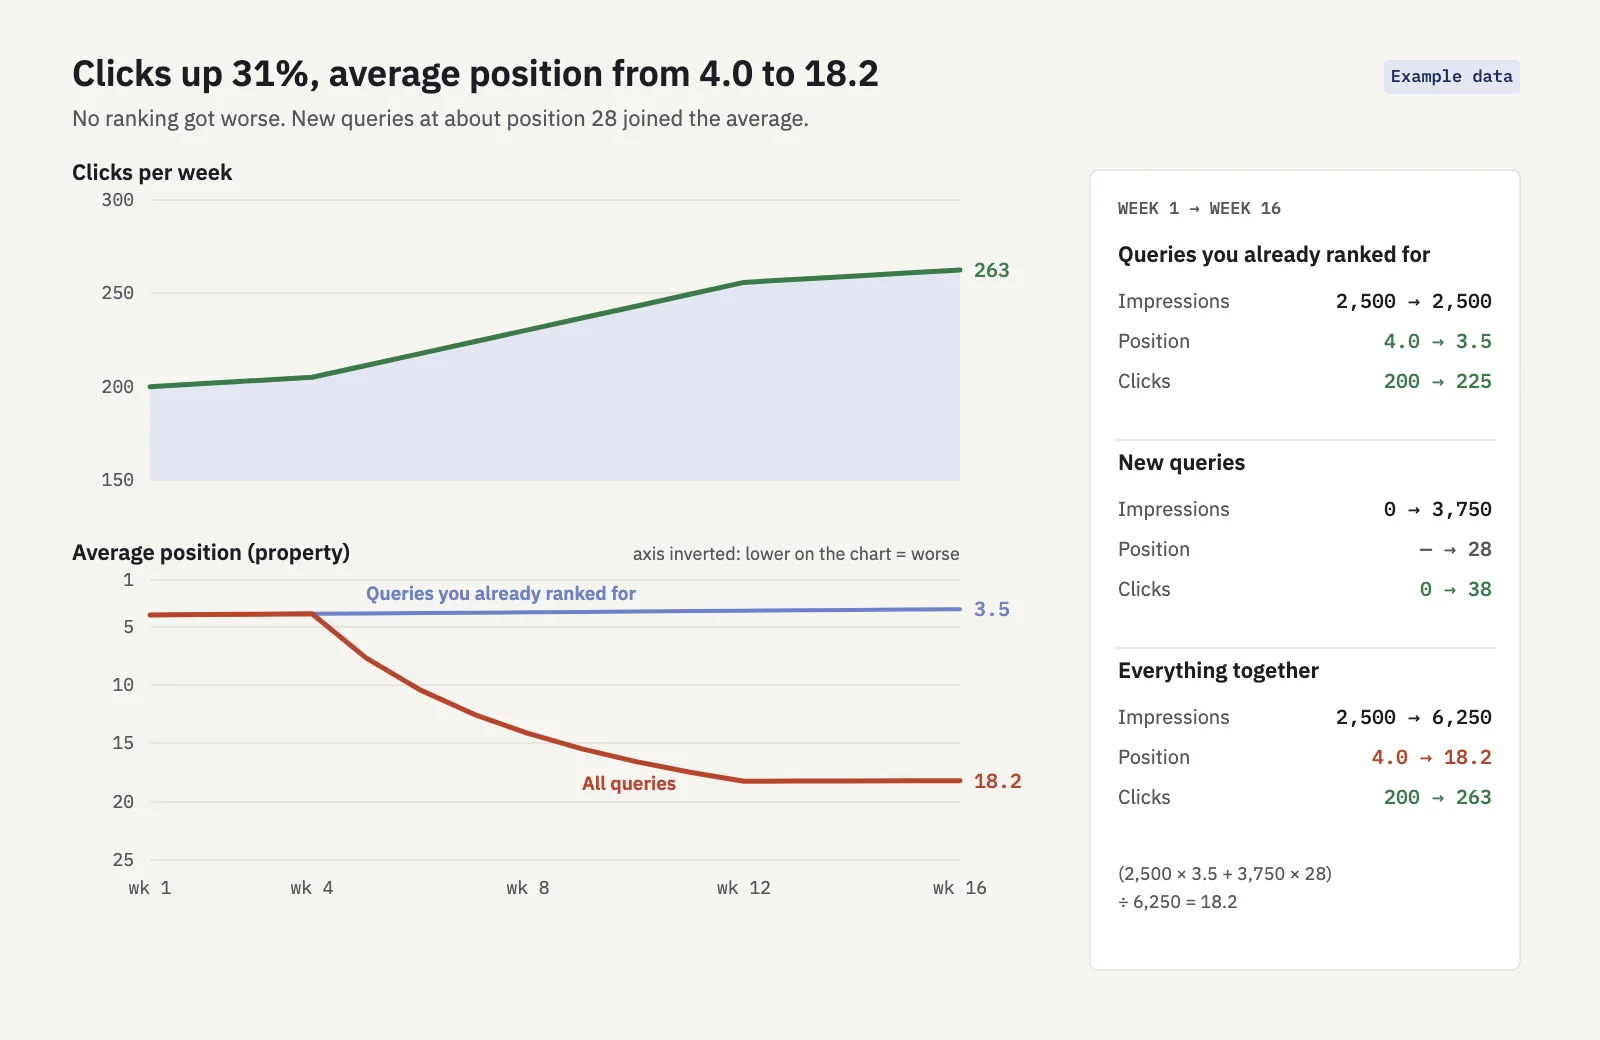 Example data. Each group improved; the mix changed.
Statisticians call this pattern Simpson's paradox: a trend that holds inside every group reverses when the groups are pooled, because the groups changed size. The opposite also happens. Losing impressions for weak long-tail queries (after pruning content, or when Google stops showing you for loosely related searches) makes the average look better while you lose reach.
The mix of devices and countries
Positions differ by device and market, and the average follows whichever one is growing. Say your pages rank at 3 on mobile and 6 on desktop, and impressions split 50/50: the average is 4.5. If mobile grows to 80% of impressions with no ranking change at all, the average becomes 0.8 × 3 + 0.2 × 6 = 3.6. The same happens with countries: expand into a market where you rank at 15 and the global average drops, even if your home market is untouched.
The fix is to read position with a Device or Country filter applied, or to compare segments side by side, before you conclude that rankings moved.
Keywords that drop out
Because only impressions count, a keyword that stops getting impressions leaves the average entirely. If your worst-ranking keywords fall out of sight, the average improves. Comparing two periods only makes sense on the keywords that had impressions in both.
What to use instead
Average position is still useful as a quick signal for a single query on a single device. For anything bigger, use these.
Position distribution buckets
Count your keywords by position range: 1–3, 4–10, 11–20, 21–50, 51 and beyond, plus "no impressions". Compare the counts at the start and end of a period. A distribution shows movement the average hides: keywords climbing into the top 3 are visible as a growing bar, and new long-tail keywords appear in the lower buckets without hiding the gains above.
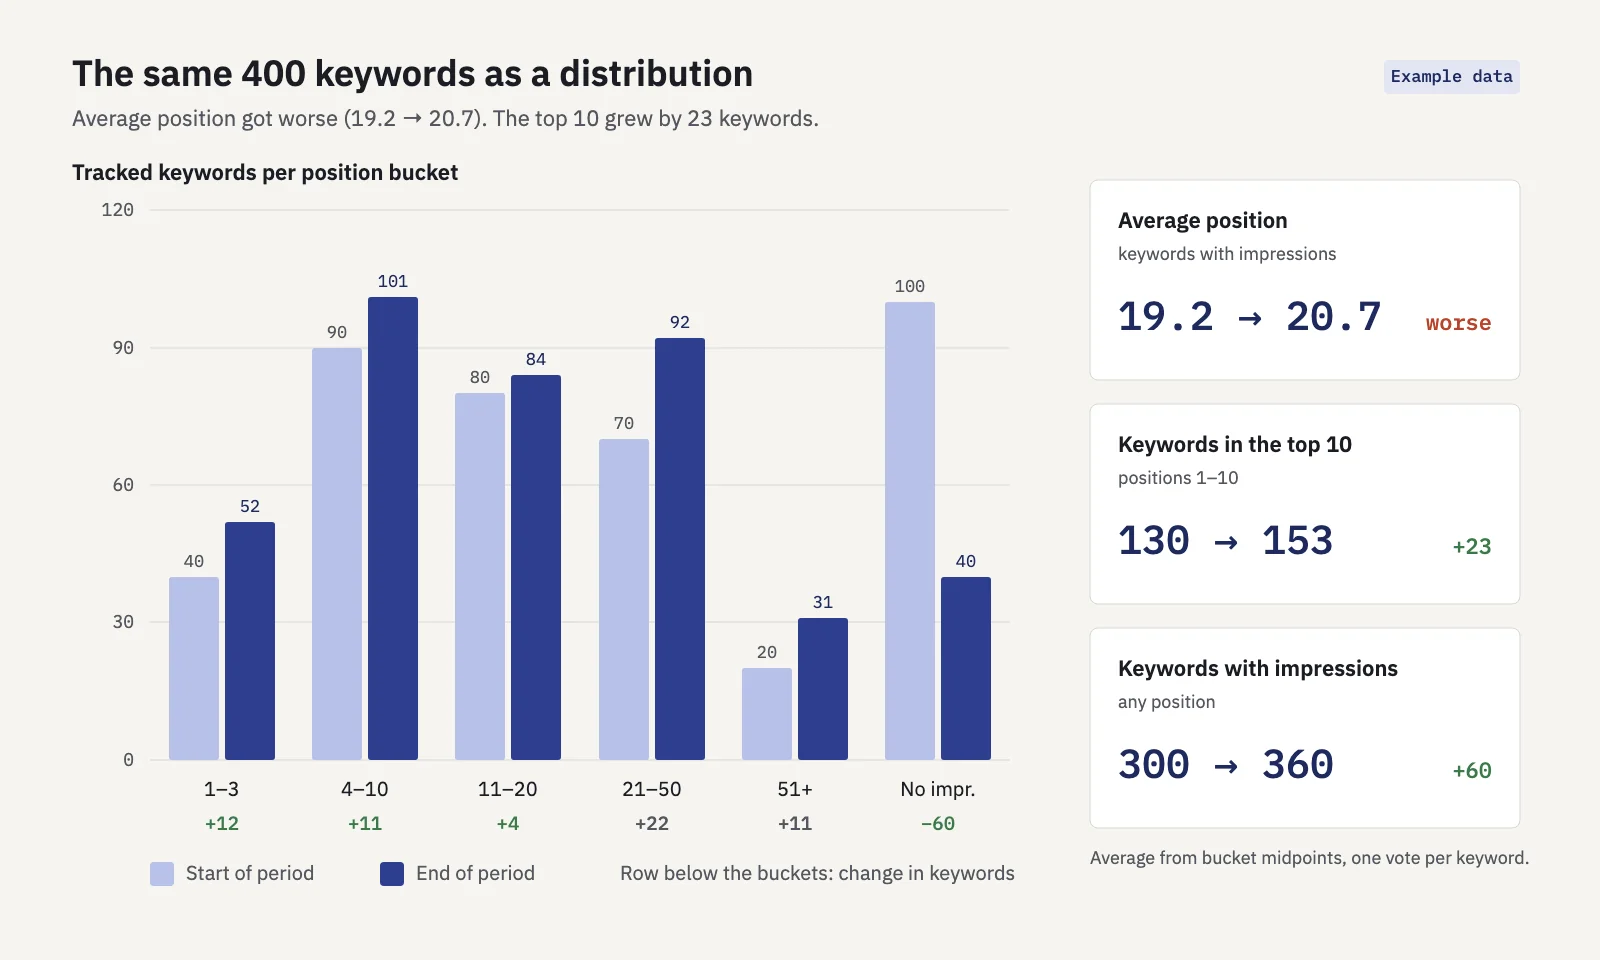 Example data. The average got worse; the distribution shows why that is good news.
Per-keyword tracking
Pick the keywords that matter to the business and track each one's position over time, ideally per device. A fixed list removes the mix problem: you compare the same queries period to period. Group them by topic or product line, so a drop in one cluster doesn't disappear into a site-wide number. (Our guide to keyword clustering in Search Console covers how to build those groups.)
Impression-weighted vs keyword-weighted views
These two answer different questions, and both are legitimate:
| Keyword | Impressions | Position |
|---|---|---|
| A | 1,000 | 2 |
| B | 100 | 15 |
| C | 50 | 40 |
| Impression-weighted average | 4.8 | |
| Keyword-weighted average | 19.0 | |
| Median keyword | 15 |
Example data.
The impression-weighted view (what Search Console shows) tells you where searchers usually found you: mostly near the top, thanks to keyword A. The keyword-weighted view treats each keyword as one vote and tells you how your keyword list as a whole is doing. If you report on a target keyword list, keyword-weighted (or a distribution) is usually the fairer number. Whichever you use, say which it is.
Medians
A mean is pulled by outliers. Take five keywords at positions 1, 2, 3, 4 and 60: the mean is 14, but the median is 3, which describes four of the five keywords far better. Use the median keyword position when a few deep-ranking terms would otherwise dominate, and report it next to the distribution rather than on its own.
How to check this in Search Console
- Open Performance > Search results and click the Average position tile so it shows on the chart along with clicks and impressions.
- Use the Date filter's Compare option to put two periods side by side, for example the last 3 months against the previous 3.
- In the Queries tab, sort by impressions and look at the position change of your top queries. If they held or improved while the chart's average fell, the mix changed, not your rankings.
- Look for new queries. Sort by impressions in the current period and scan for queries with few or no impressions in the earlier one. Those are usually what pulled the average.
- Add a Device filter, then a Country filter (via + Add filter) and repeat the comparison. If one segment grew much faster, read each segment's position on its own.
- Export the Queries table and bucket it. Count queries per position range in a spreadsheet and compute the median. The UI export stops at 1,000 rows and leaves out anonymized queries, so on large sites treat it as a sample or use the API or bulk export.
Serplyze does this for the keywords you track. Its rank tracker shows a ranking spread (positions 1–3, 4–10, 11–20, 21–50, 51–100 and no impressions, at the start and end of the period) and a ranking spread over time by day, week or month. The average position figure is impression-weighted over keywords with impressions, shows how many of your keywords it covers, and compares only keywords that had impressions in both periods, so keywords dropping out can't make it look better.
Reporting average position without misleading anyone
If position goes into a client or management report, a few habits keep it honest:
- Report a distribution or "keywords in the top 3 / top 10" as the headline, with average position as a secondary figure.
- Report position for a fixed keyword set, not the whole property, and label it as impression-weighted or keyword-weighted.
- Put clicks next to position. A worse average with more clicks is usually expansion, not decline.
- When an average moves sharply, check new queries, device mix and country mix before calling it a ranking change. After a Google update, use a per-keyword comparison like the one in our core update impact guide.
For which numbers to lead with, see our guides to SEO KPIs and the SEO visibility score, which weighs position by the clicks it can bring rather than averaging it.
Key takeaways
- Search Console records your site's topmost position for each impression and averages those values, so high-impression queries dominate.
- Each search feature takes one position: an AI Overview, a carousel or a knowledge panel counts once for all its links.
- The chart aggregates by property and the Pages table by page, so their averages differ by design.
- New low-ranking queries, device and country mix, and keywords dropping out all move the average without any ranking change.
- Use position buckets, a fixed keyword list, a stated weighting and medians, and always read position next to clicks.
Serplyze tracks your chosen keywords daily from your own Search Console data, with the ranking spread and like-for-like position changes built in. Start free and see how your keywords are really distributed.