You can track keyword rankings two ways: check a list of keywords against Google's results pages, or read the positions Google already records for your site in Search Console. This guide compares the two, then shows how to track rankings with Search Console alone: choosing keywords, grouping them, splitting by device and country, and reporting the result.
Two ways to track keyword rankings
Scraped SERP checks. You give a tool a list of keywords, a location and a device. Once a day (or once a week) it runs each search, reads the results page and records where your URL appeared. The output is one position per keyword per check.
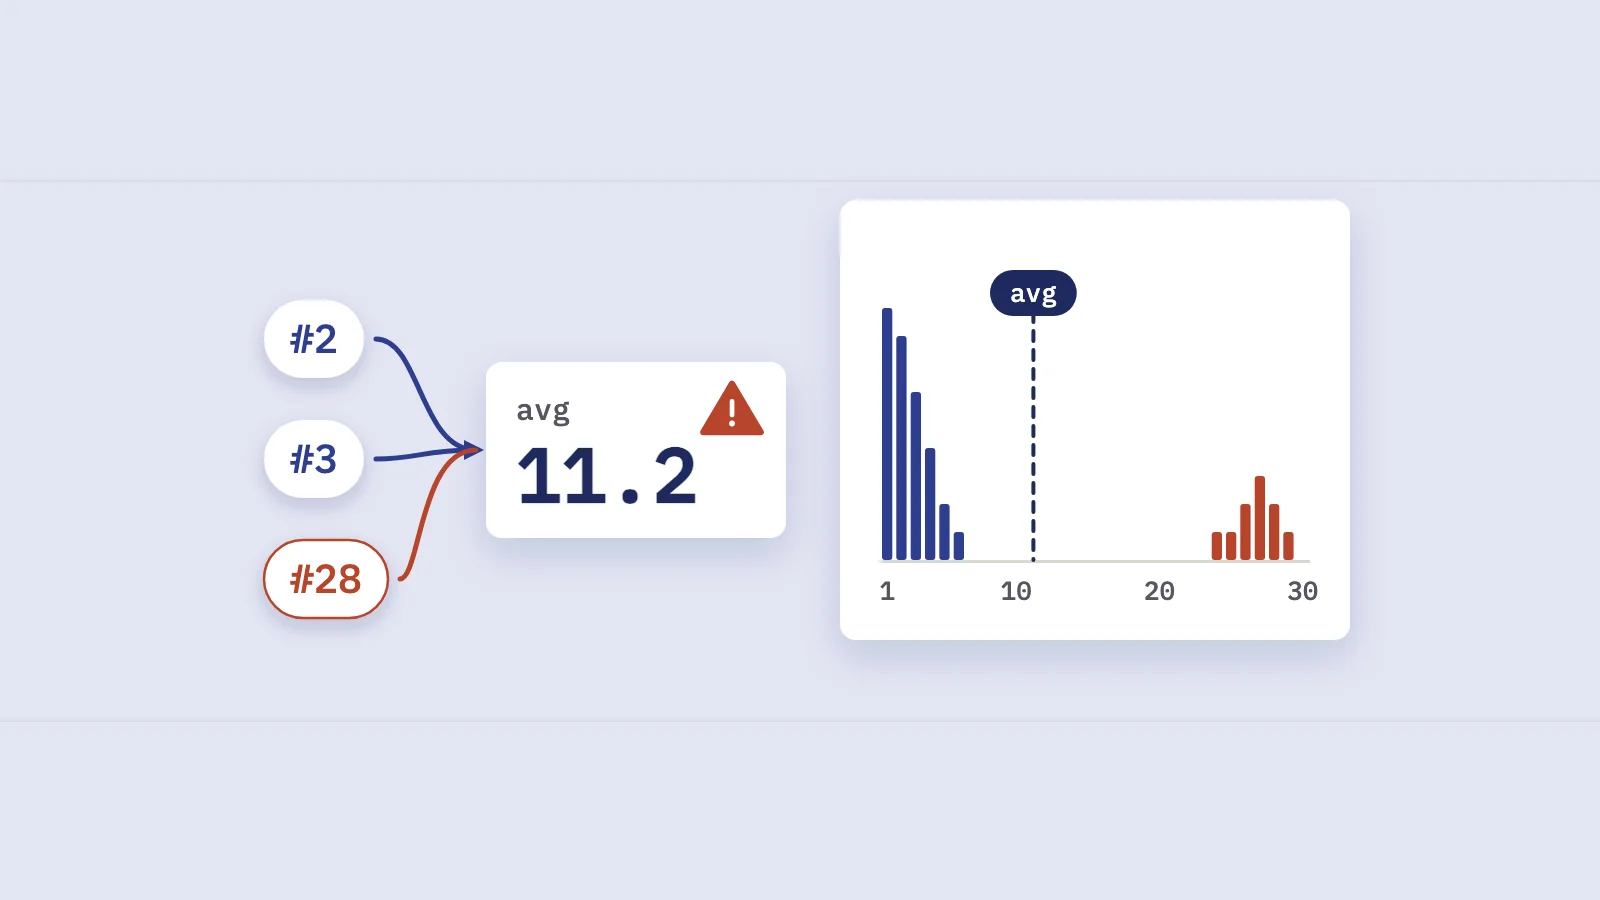
Search Console data. Google records every time your site appears in its results. In the Performance report, position is the topmost spot your link held, averaged across all impressions. So a keyword's position is not one check: it is an average of every real search where your site was shown, from every location and device, with the clicks and impressions those searches produced.
Neither method is a keyword database. You aren't buying estimated volumes for millions of terms. You're measuring your own site, either with a sample (one search, one place) or with Google's own record of what searchers saw.
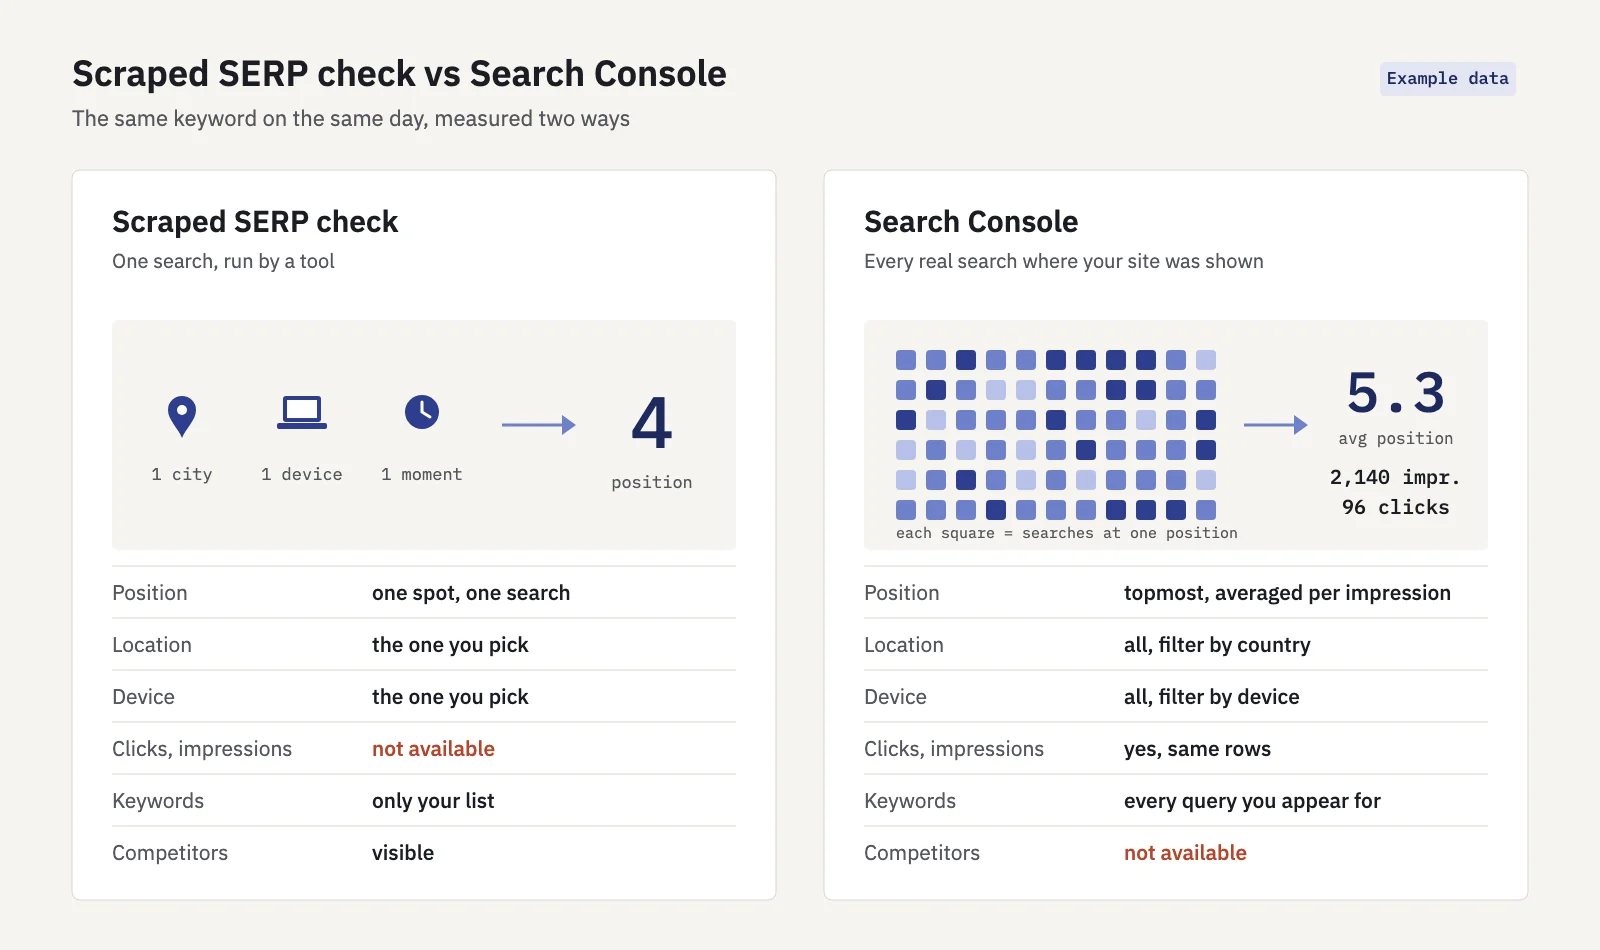 Example data. One sampled position versus an average of real impressions.
What each method gets right and wrong
| Scraped SERP checks | Search Console data | |
|---|---|---|
| What the position means | Where you appeared in one search, from one place, at one moment | Topmost position, averaged across every impression |
| Keywords covered | Only the list you enter | Every query you appeared for (minus anonymized ones) |
| Keywords you don't rank for yet | Recorded as not ranking | Not shown until Google first shows your site |
| Clicks and impressions | No | Yes, for the same rows |
| Competitor positions | Yes | No, only your own properties |
| SERP features on the page | Usually recorded | Not shown per keyword |
| History | From the day you start | 16 months, including the past before you started |
| Location and device | You pick one per check | Filter by country and device after the fact |
The case for scraped checks: you can track keywords where you're nowhere yet, see who outranks you, and get one exact spot for one city. That matters for local businesses and for new sites with almost no impressions.
The case for Search Console: the number reflects what real searchers saw, it comes with the clicks that tell you whether the position mattered, and it covers queries you never thought to add. A scraped check can say you're 4th in one city while most of your searchers, elsewhere or on another device, saw you 8th.
The catch with Search Console is that position is an average, and averages move when the mix of searches changes. Our guide to average position in Search Console explains how to read it without being misled. Search Console also hides rare queries for privacy (see anonymized queries), and it only knows about queries you already appear for.
How to track keyword rankings in Search Console alone
Search Console has no saved keyword list, but you can get a working rank tracker from the Performance report and a spreadsheet.
- Open Performance > Search results for your property, keep the search type on Web, and set the date range to the last 3 months. Click the Average position card so the metric shows on the chart and in the table.
- Filter to your keyword list. Click + Add filter, choose Query, then Custom (regex). Search Console uses RE2 syntax, with partial matches and case-insensitive matching by default, so anchor the terms for exact matches:
^(rank tracker|keyword rank tracker|track keyword rankings)$. - Read the Queries tab. Each row is one tracked keyword with its clicks, impressions, CTR and position for the period. The chart above it blends all matching queries into one line, so for one keyword's daily trend, filter to that query alone.
- Compare periods. Open the Date filter, choose Compare, and pick the previous period or the same period last year. The table then shows both periods side by side.
- Export and keep a log. Export the table and paste it into a sheet with the date. The UI export is capped at 1,000 rows, which is plenty for a focused list; for more, use the Search Analytics API, which returns up to 25,000 rows per request.
- Repeat on a schedule. Weekly is enough for most sites. Search Console keeps 16 months of data; your sheet is what lets you look back further.
Track with weekly or monthly views, not daily ones. A keyword with 30 impressions a day can swing three positions on a quiet Sunday without anything having changed.
The manual approach breaks down at a few hundred keywords or several sites: the regex gets long, the chart blends everything, and nobody keeps the export going. That's the point where a tool that stores the history for you starts to pay.
Choosing which keywords to track
Search Console already lists every query you appear for. Tracking means choosing the ones you'll watch and report on. A good list usually has:
- Money keywords. Queries that lead to signups, sales or leads, and the pages that convert them.
- Striking-distance keywords. Queries at positions 4 to 20 with real impressions, where a move of a few places changes clicks the most.
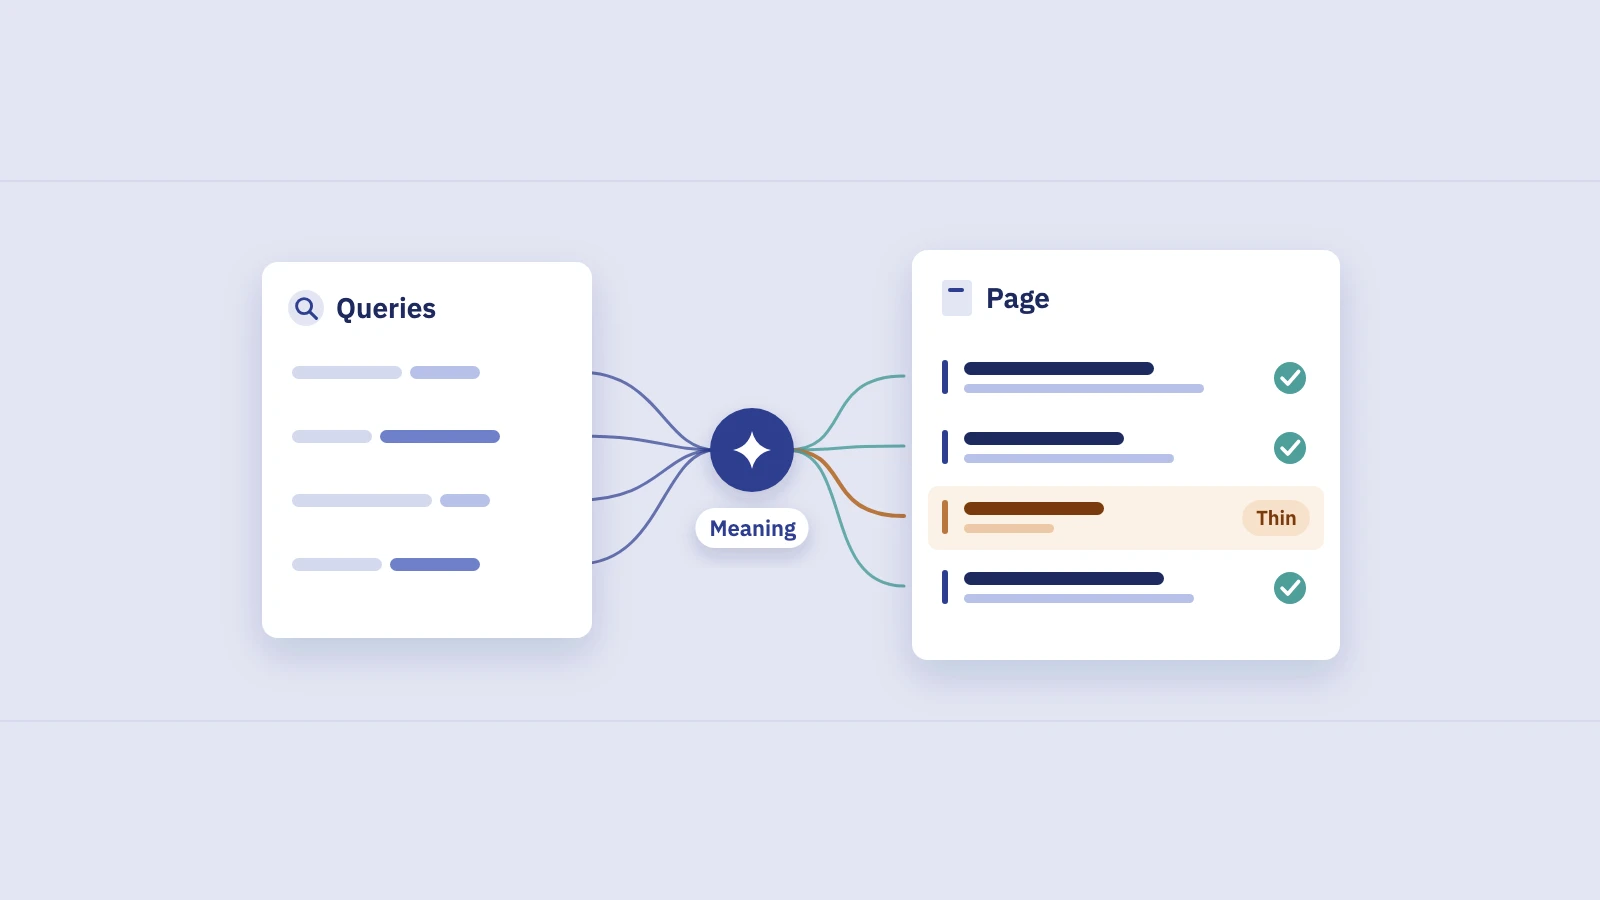
- One query per intent, not every variant. "Rank tracker", "rank tracking tool" and "keyword rank tracker" often share a results page. Track the main one or two and let the group carry the rest.
- A few targets you don't rank for yet. Add them knowing they will show nothing until Google first shows your site.
- Brand terms, tracked separately. Branded rankings are almost always near 1 and hide movement in the rest of the list. Keep them in their own group (more in branded vs non-branded traffic).
Revisit the list every quarter. New queries appear, products change, and some keywords stop mattering.
Grouping keywords
Single keywords make noisy reports. Groups make the list readable and give you one number per part of the business.
| Group by | Example | Answers |
|---|---|---|
| Topic or product category | "Running shoes", "Trail shoes" | Which part of the catalogue is gaining or losing? |
| Funnel stage or intent | Informational, comparison, purchase | Are we winning the searches that convert? |
| Landing page or folder | Everything ranking with /blog/ | Did the blog migration hurt? |
| Brand vs non-brand | Branded, Non-branded | Is growth coming from new searchers? |
| Market | US, UK, Germany | Where are we strongest? |
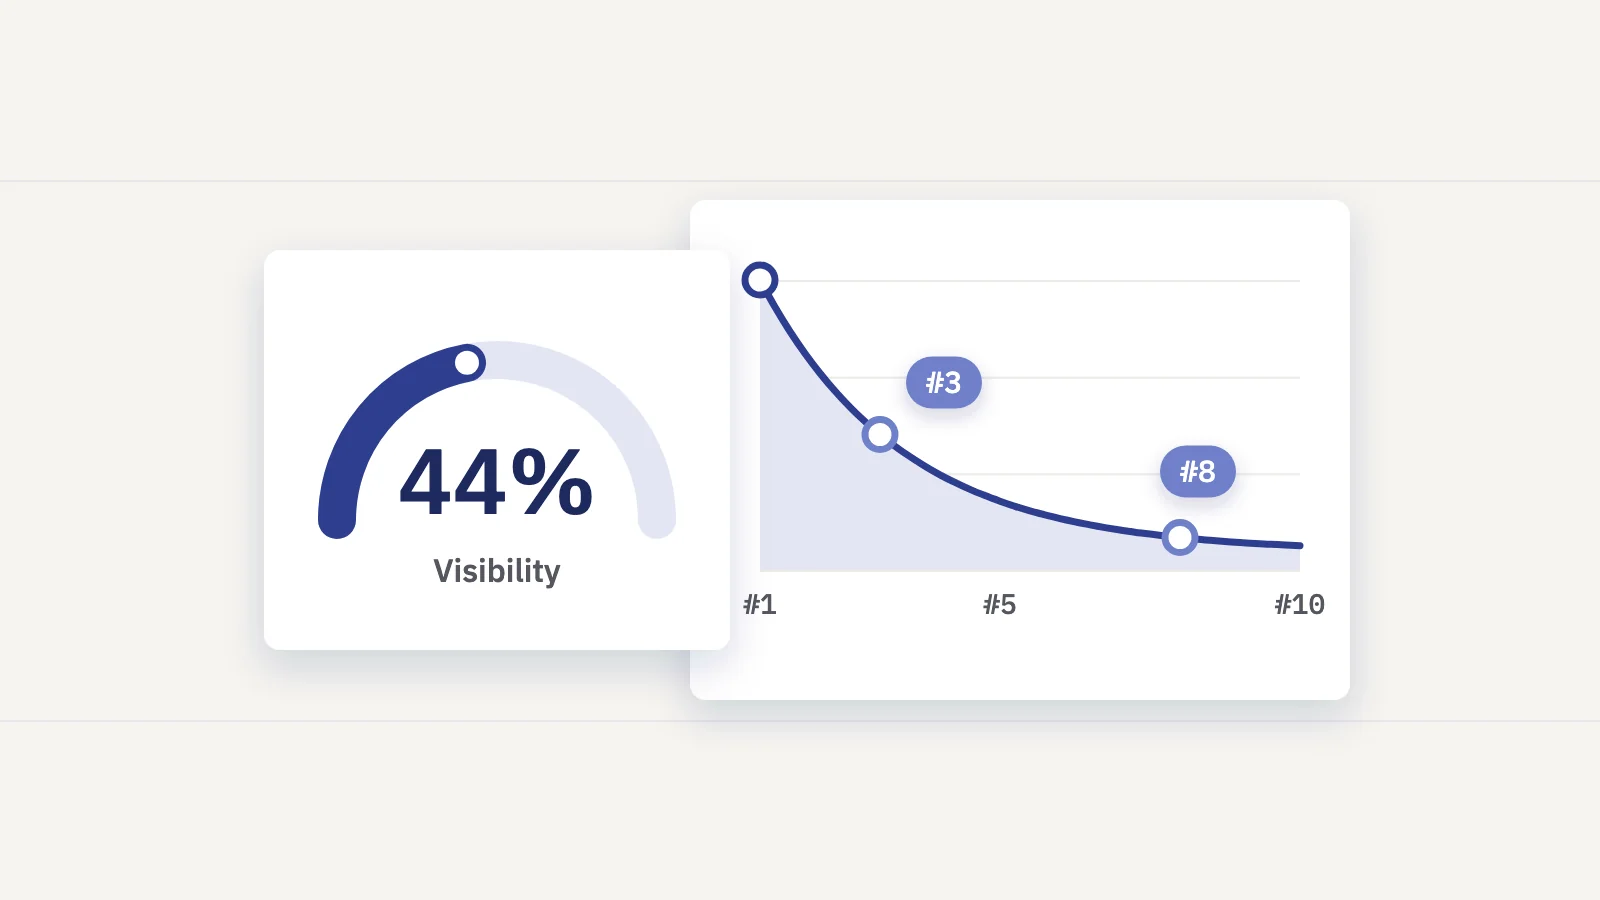
For each group, report an impressions-weighted average position (a keyword seen 10,000 times should count more than one seen 50 times), total clicks, and how many keywords sit in positions 1 to 3, 4 to 10, 11 to 20 and below. That spread shows movement an average hides. If you're building groups from scratch, keyword clustering with Search Console data walks through grouping queries that share a results page.
Device and country
Mobile and desktop rankings for the same keyword often differ by a few places. Different layouts, different SERP features and different competing pages all play a part. In Search Console, add a Device filter (Desktop, Mobile or Tablet) to see each one, or switch the table to the Devices tab with one query filtered.
The all-devices number is a blend weighted by impressions. If 70% of a keyword's impressions come from phones, the combined position will sit close to the mobile line, even when desktop is much better.
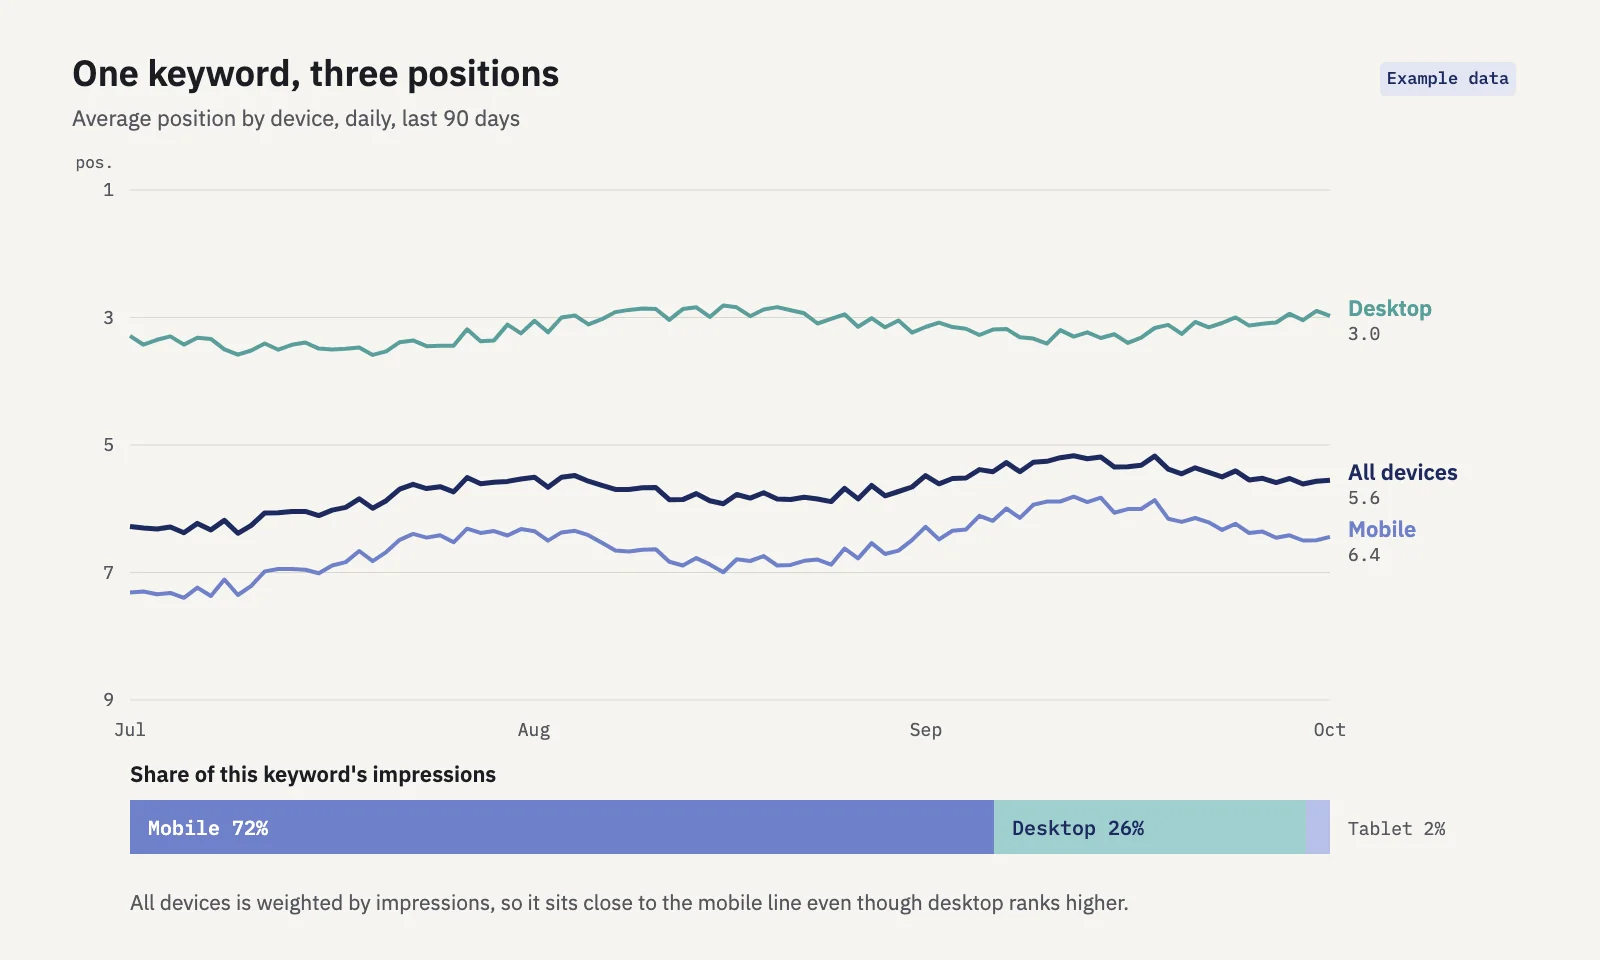 Example data. The combined position follows whichever device has most of the impressions.
Country works the same way. An all-countries position mixes every market you appear in, so a site that ranks 2nd in the UK and 15th in the US will show a number that describes neither. Add a Country filter for each market you report on, or keep a separate list per market. A scraped tracker makes you choose one location up front; with Search Console you choose afterwards, and you only see countries where you actually had impressions.
Reporting keyword rankings
A ranking report should answer three questions: what moved, did it matter, and what are we doing about it.
- Show position next to clicks. A move from 9 to 4 with no extra clicks usually means the query has little demand or a SERP feature is taking the clicks.
- Report groups first, keywords second. Lead with the groups' average position and rank spread, then list the biggest movers in each.
- Compare with the previous period and the same period last year. Seasonal sites need the year-over-year view, or every January looks like a crash.
- Note what you changed. A title rewrite, a migration or a Google update next to the date it happened explains most movements before anyone asks.
Our SEO report template has a full layout, and SEO KPIs covers which ranking metrics deserve a place in it.
Doing it in a rank tracker built on Search Console
Serplyze's rank tracker automates the steps above with the same Search Console numbers. You add keywords from your top queries, by pasting a list or by importing a CSV, and a sync reads each keyword's position, clicks, impressions and CTR every day. Keywords sit in folders, hand-picked groups and rule-based groups that match on query text, landing URL or metrics. Each group gets a visibility score and rank spread. A device switch shows All devices, Mobile or Desktop. Each project can be filtered to one country, and on paid plans each keyword also has a per-country breakdown. Keyword history is backfilled from Search Console when you connect: how far depends on the plan, up to 16 months with the history add-on.
Built-in alerts flag rank drops, top-20 keywords that lose all impressions, and site-wide traffic drops. You can add up to 50 rules per project on position, clicks, impressions, visibility or the ranking URL (for example, when a keyword ranks with a page other than the one you set as its target). There's no competitor tracking, because Search Console only reports your own sites.
Key takeaways
- Scraped checks give one position from one place; Search Console gives the average of every real impression, with clicks, for every query you appear for.
- Use scraped checks for keywords you don't rank for yet and for competitors; use Search Console to see what searchers actually saw.
- In Search Console, track a list with a regex Query filter, the Average position metric, Compare, and a weekly export.
- Track money and striking-distance keywords, keep brand terms separate, and report groups before single keywords.
- Split by device and country: blended positions follow wherever most impressions come from.
Serplyze turns your Search Console data into a daily rank tracker with groups, device views, history and alerts, with nothing to scrape. Start free and track your first keywords in a few minutes.