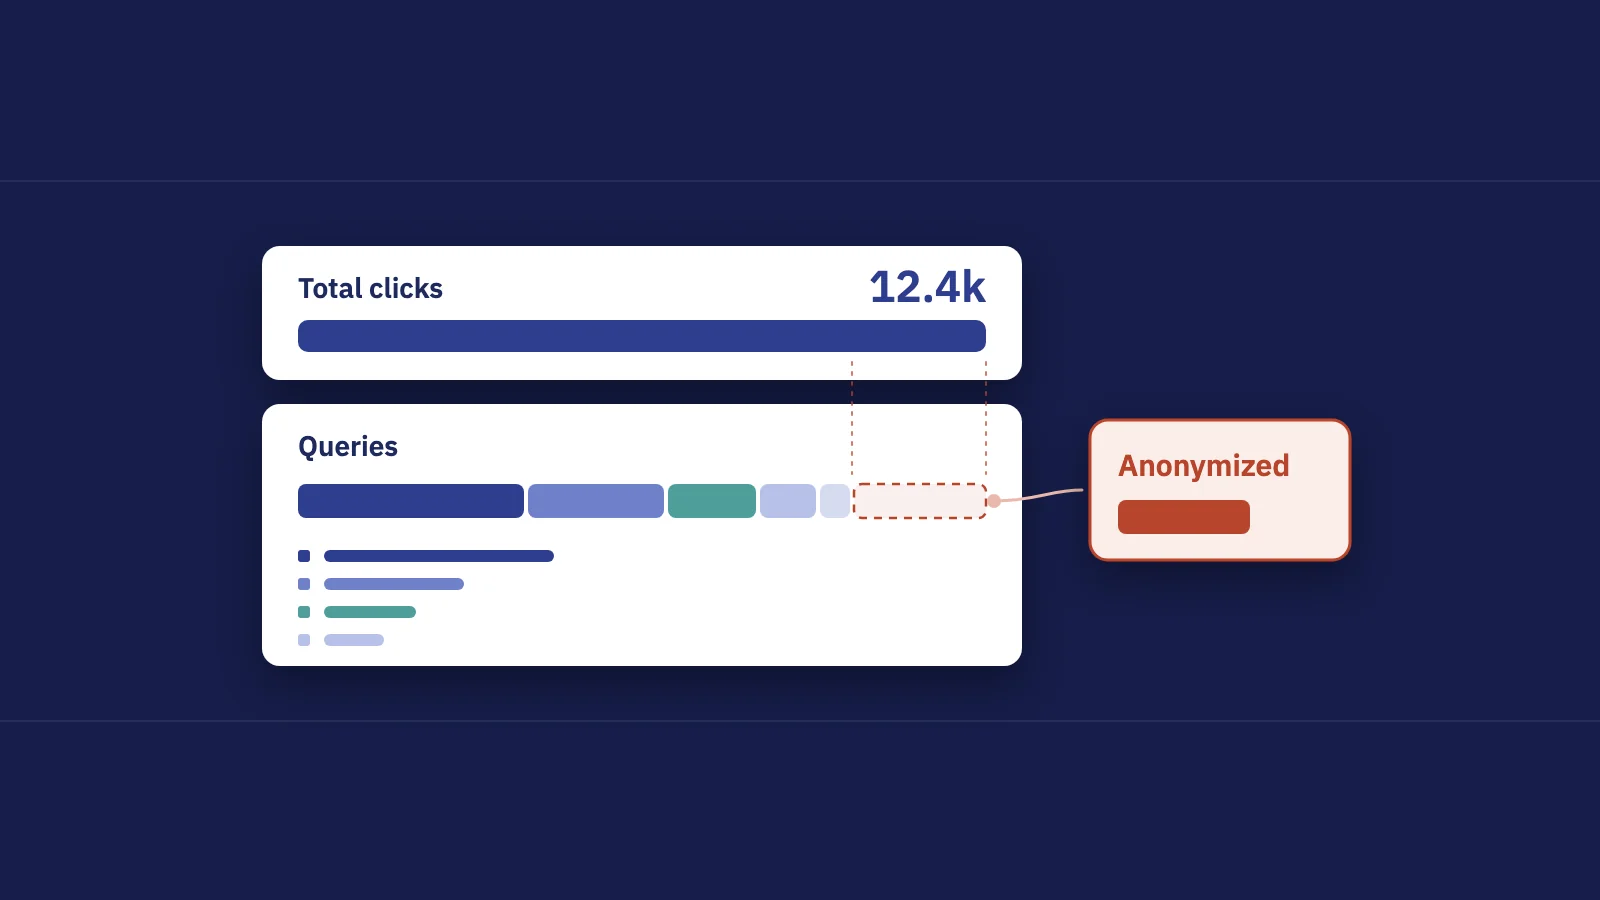
Add up the clicks in Search Console's Queries table and you will rarely reach the total above the chart. The gap comes from anonymized queries, searches Google counts but won't name, plus a few mechanics of how the report counts. Here is what they are, the other reasons totals drift apart, and how to measure and report the gap on your own site.
What anonymized queries are
Google explains it in its deep dive on performance data (Daniel Waisberg, October 2022): some queries are left out of Search Console data "to protect the privacy of the user making the query". These anonymized queries are ones that "aren't issued by more than a few dozen users over a two-to-three month period."
Three rules follow, all from Google's documentation:
- They are never listed. The Queries table, its export and the Search Analytics API leave them out, and there is no "other" row standing in for them.
- They are counted in the chart. Their clicks and impressions are part of the totals above the chart, as long as no query filter is applied.
- A query filter removes them. As soon as you filter by query, the totals drop to named queries only. The troubleshooting page adds that filtering by query or URL can change totals through omitted anonymized queries and data truncation.
Google's own example: four listed queries add up to 450 clicks while the chart shows 550. The missing 100 clicks came from searches too rare to show.
Why the chart total and the table don't match
Anonymized queries are the best-known reason, but not the only one. Four mechanisms separate the chart from the rows below it:
| Cause | What happens | Where you see it |
|---|---|---|
| Anonymized queries | Counted in the chart, never listed in the table | Queries tab, any query export |
| Row limits | The UI shows and exports at most 1,000 rows; the API stops at 50,000 rows per day per search type | Large sites with a long tail |
| Property vs page aggregation | The chart counts one impression per site per search; the Pages table counts each URL | Pages tab, page filters |
| Filters | A query filter drops anonymized queries; page and search appearance filters change the aggregation | "Matches" plus "doesn't match" not adding up to the total |
Row limits
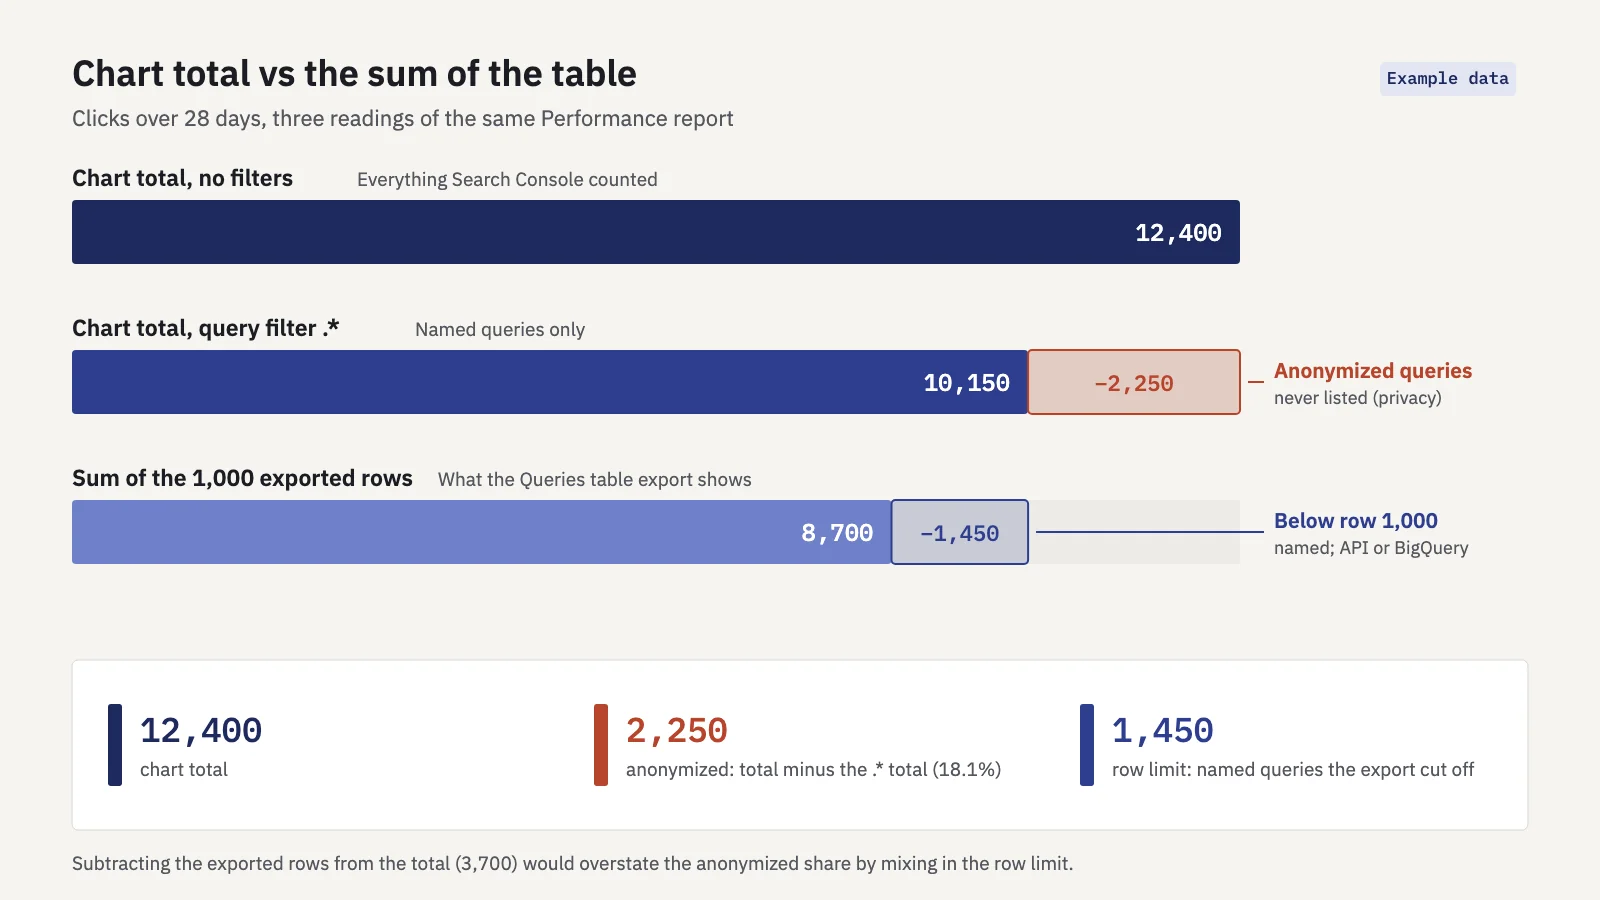
The deep dive gives the numbers. The Search Console interface exports at most 1,000 rows. The Search Analytics API and the Looker Studio connector return up to 50,000 rows per day per site per search type, "which may not be reached in all cases". Google says these limits affect only a few very large sites, and that reports without query or URL dimensions (countries, devices, search appearance) are complete.
So on a big site, the 1,000 rows in the UI miss two things: anonymized queries, and named queries ranked below row 1,000. The second part isn't a privacy gap. You can recover much of it with the API, or all of it with the bulk export to BigQuery, which Google says is not affected by the daily row limit. The export still hides the text of anonymized queries, but it marks their rows with an is_anonymized_query field.
Property vs page aggregation
The Performance report help says the chart is "aggregated by property": if two of your pages appear for one search, that is one impression in the chart total. Tables grouped by query, country, device or date are aggregated by property too. Tables grouped by page or search appearance are aggregated by page, so both URLs get an impression.
The result: the Pages tab can add up to more impressions than the chart. And adding a page or search appearance filter switches the chart to page aggregation, so the totals can rise. Neither is an error. They are two ways of counting.
Filters
Google's example makes the filter effect concrete. With a query filter for "fiction" the chart shows 175 clicks; with "doesn't contain fiction" it shows 275. Together that's 450, not the 550 total, because both filtered views leave out the anonymized 100. The same applies to every brand vs non-brand split built from query filters: brand plus non-brand will fall short of the total. The regex filters guide has patterns for these splits.
Click a single page and open its Queries tab and you'll see the same thing on a small scale: the listed queries usually add up to less than the page's clicks.
How to estimate your anonymized share
Search Console won't show the anonymized share, but you can work it out with two readings of the same report. The trick: a query filter that matches every named query drops the anonymized ones, so the difference between the two totals is what was anonymized.
- Open Performance > Search results with search type Web and a date range of at least a month. Leave all filters off. Note total clicks and total impressions.
- Add a query filter that matches everything. + Add filter > Query > Custom (regex) > Matches regex, pattern
.*, Apply. The chart now shows named queries only. Note both totals again. - Subtract and divide. Total minus named is the anonymized estimate. Divide it by the total for the share, separately for clicks and impressions.
- Repeat for a few months. A single month is a snapshot. The trend tells you whether your traffic is moving toward rarer searches.
- Go to row level if you need it. The bulk export to BigQuery marks each anonymized row, so you can break the share down by page, country or device.
Here is how that looks for an example site over 28 days. Example data:
| Reading | Clicks | Impressions |
|---|---|---|
| Chart total, no filters | 12,400 | 610,000 |
Query filter .* (named queries) |
10,150 | 401,000 |
| Anonymized estimate | 2,250 | 209,000 |
| Anonymized share | 18.1% | 34.3% |
| Sum of the 1,000 exported rows | 8,700 | 312,000 |
The last row shows why exporting the table and summing it is the wrong method. The 1,000 rows add up to 8,700 clicks, so subtracting them from the total would suggest 3,700 anonymized clicks. But 1,450 of those clicks belong to named queries that simply didn't fit in the export.
Treat the result as an estimate. Google says filtered totals can also be affected by data truncation on large sites, so the named-query total from step 2 may be slightly low, which makes the anonymized share look slightly high.
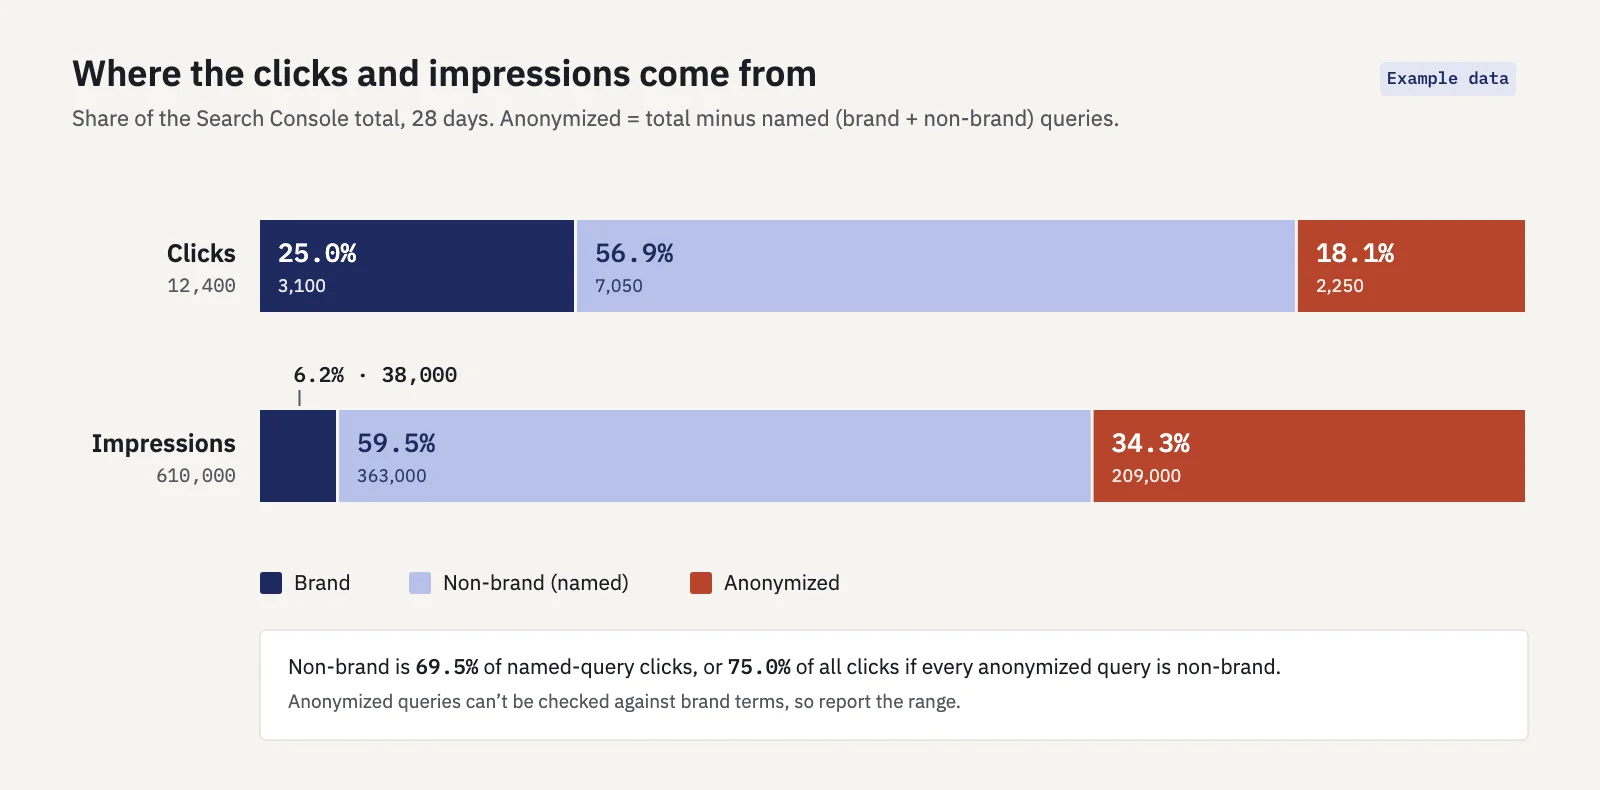
In the example the anonymized share of impressions is about twice the share of clicks. Your own ratio may look quite different, so measure both rather than assuming one from the other.
Which sites have more anonymized queries
Google's definition decides it: a query is anonymized when only a few dozen people or fewer searched it in two to three months. Anything that pushes your traffic toward rare searches raises the share:
- Small and niche sites. When few people search your topic at all, many queries never pass the threshold.
- Long-tail content. Large catalogs, support articles, forums, recipes and Q&A pages attract long, specific queries, many of them typed only once.
- Local businesses. Queries with street names, neighborhoods or staff names are rare by nature.
- Searches containing names. Directories, B2B sites and anything people search with a person's or company's name in the query.
- Smaller languages and markets. The same question in a language with fewer speakers is searched by fewer people.
Sites built on a few big head terms, or with lots of navigational brand searches, tend to see a smaller share, because those queries are searched by many people.
A changing share is information, not noise. If it rises after you publish a lot of detailed content, you are probably reaching more long-tail searches than the Queries table can show. Our guide to zero-click searches covers another reason clicks and the visible query list can drift apart.
How to report it honestly
Anonymized queries are where reports quietly go wrong. A few habits keep yours straight:
- Say which total you use. "All queries (Search Console total)" and "named queries" are different numbers. Label every chart and KPI with the one it shows.
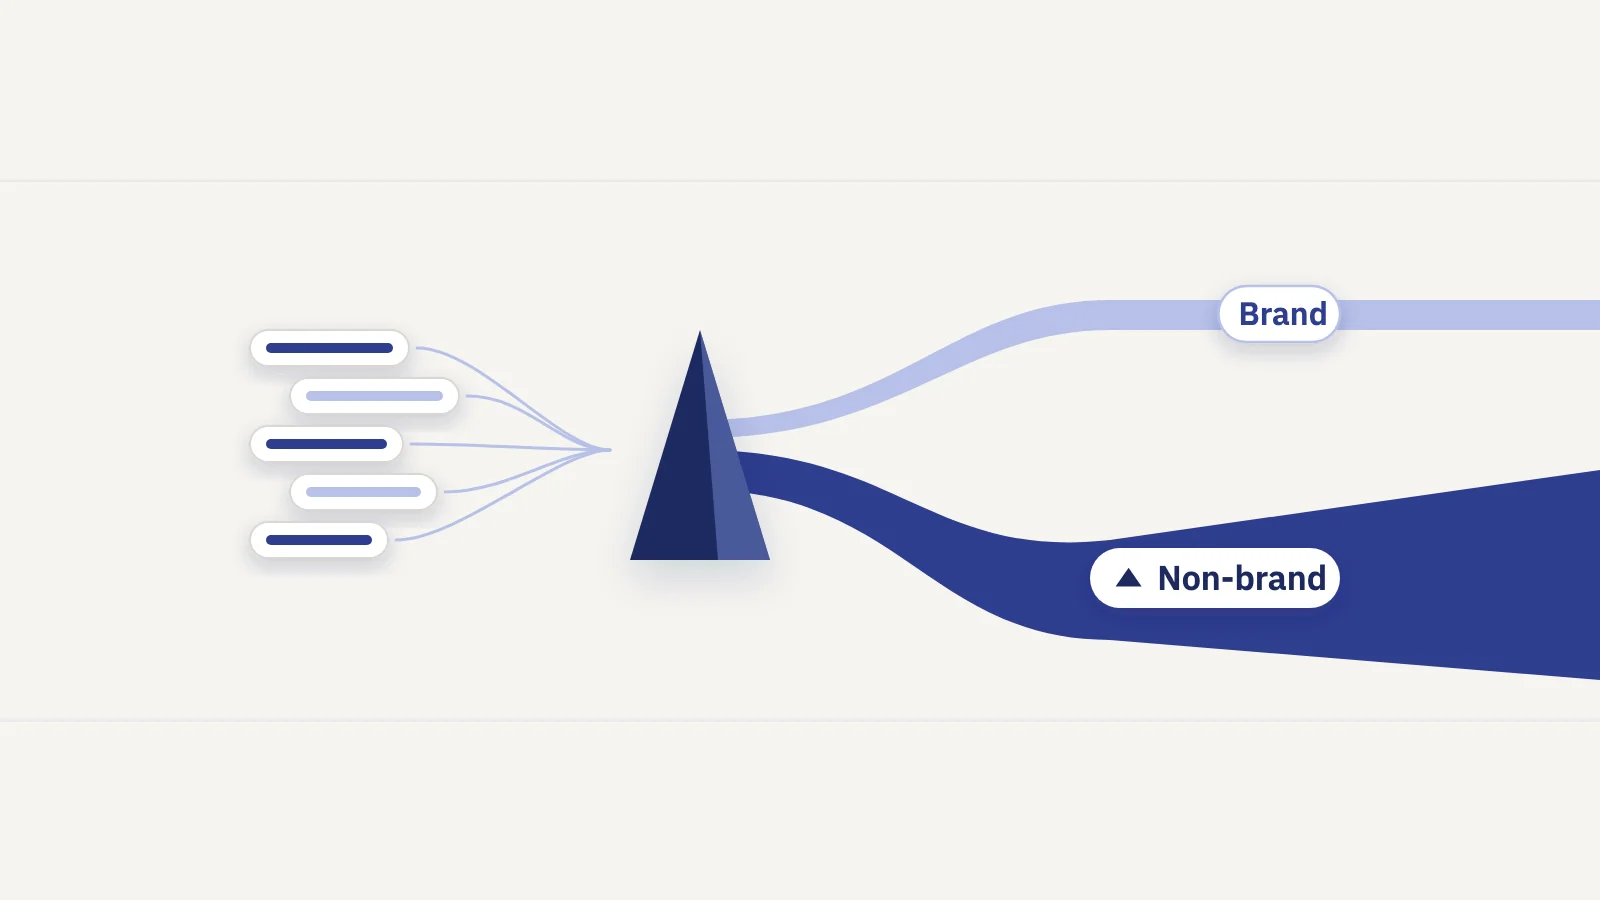
- Show anonymized as its own line. Don't fold it into non-brand and don't drop it. In a brand split, report three segments: brand, named non-brand, anonymized.
- Give brand shares as a range. Anonymized queries can't be checked against brand terms. Most of them are likely long-tail non-brand searches, but that's an assumption. In the example, non-brand is 69.5% of named-query clicks, or 75.0% of all clicks if every anonymized query is non-brand. Say both.
- Never add filtered totals and expect the whole. Brand clicks plus non-brand clicks won't match total clicks. Explain the gap once and the question stops coming back.
- Keep the method fixed. Switching from UI exports to the API or BigQuery changes how much of the long tail you see. Note the switch in the report, or old and new periods won't compare.
Our SEO report template shows where a note like this fits, and the SEO KPIs guide covers which totals to put on the first page.
Serplyze does the subtraction for you. The Brand vs non-brand card on the Traffic screen shows brand, non-brand (named queries) and an "Anonymized (likely non-brand)" row as shares of all clicks, with the site total minus named queries as the anonymized figure. Its note spells out the non-brand share both ways. The same split is a section in Serplyze reports, by clicks or impressions.
Key takeaways
- Anonymized queries are searches made by no more than a few dozen people in two to three months; Google hides them for privacy.
- They are counted in chart totals, never listed in tables, and dropped as soon as you filter by query.
- Row limits (1,000 in the UI, 50,000 per day in the API) and property vs page aggregation also make tables and charts disagree.
- Estimate the anonymized share as the unfiltered total minus the total under a query filter of
.*, for clicks and impressions separately. - In reports, label which total you use, show anonymized as its own segment and give brand shares as a range.
Serplyze builds on your own Search Console data and keeps anonymized traffic visible instead of letting it disappear from the sums. Start free and see how much of your traffic Search Console doesn't name.