A good SEO report answers three questions in under five minutes: what happened, why, and what we do next. Below is a monthly SEO report template you can copy, followed by what goes in each section, where the numbers come from in Search Console and GA4, and an example sentence for each.
What an SEO report is for
An SEO report is not a data dump. It's a short argument: here is how organic search did against what we expected, here is the reason, and here is the plan. Every chart in it should support one of those three parts. If a chart doesn't, it belongs in the appendix or nowhere.
That framing also decides the order. The reader who stops after the first screen should still leave with the right picture, so the summary and the scorecard come first and the detail comes last.
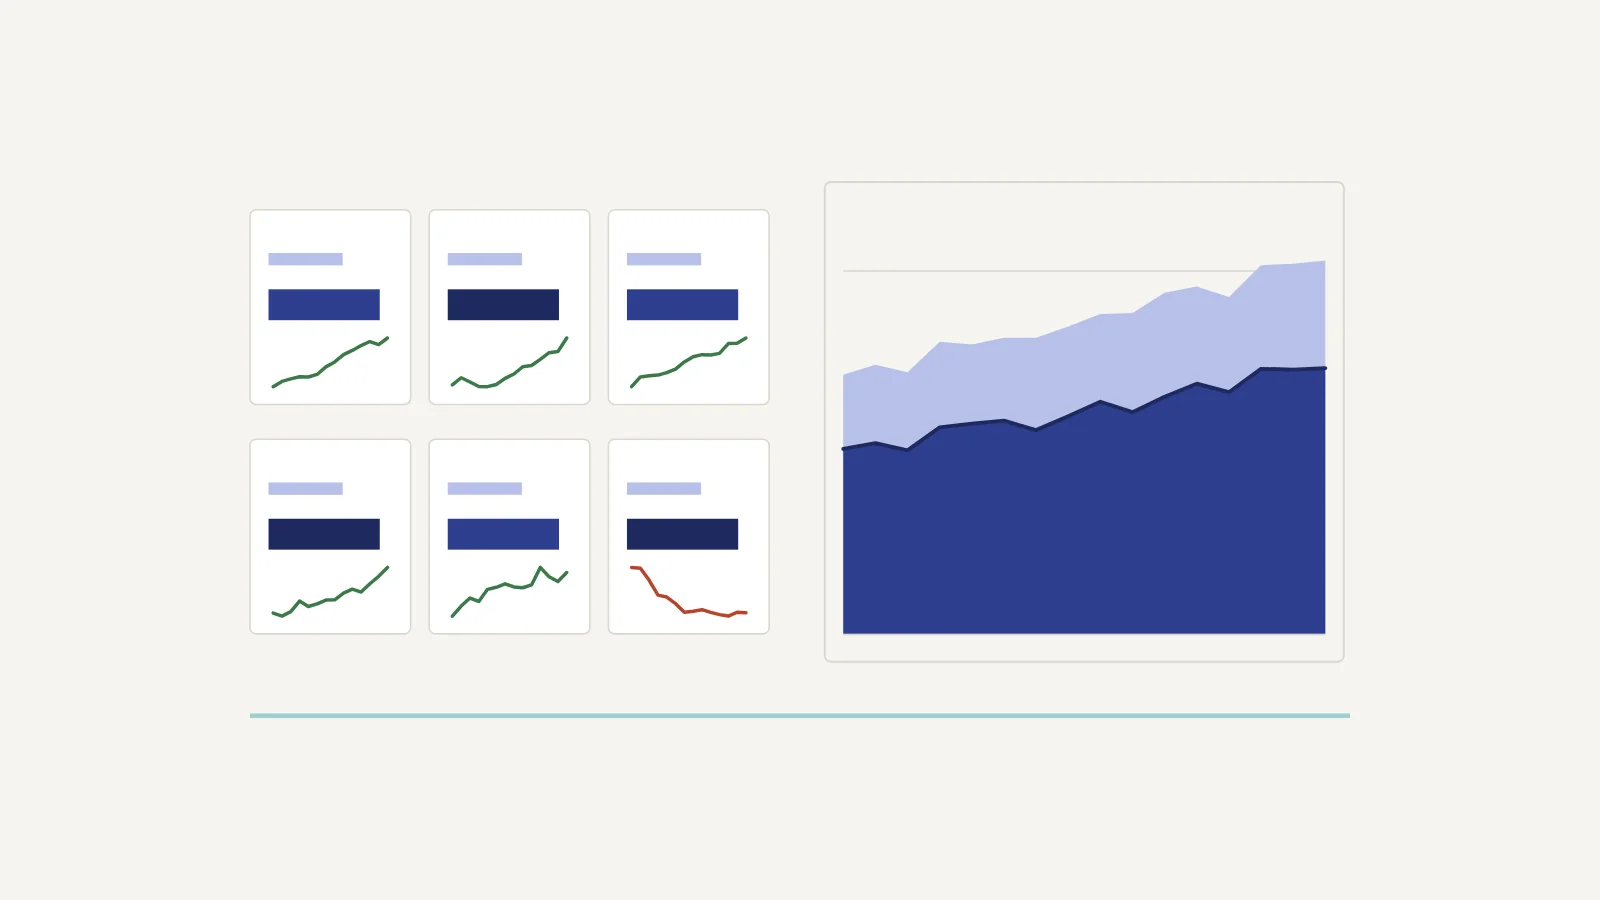
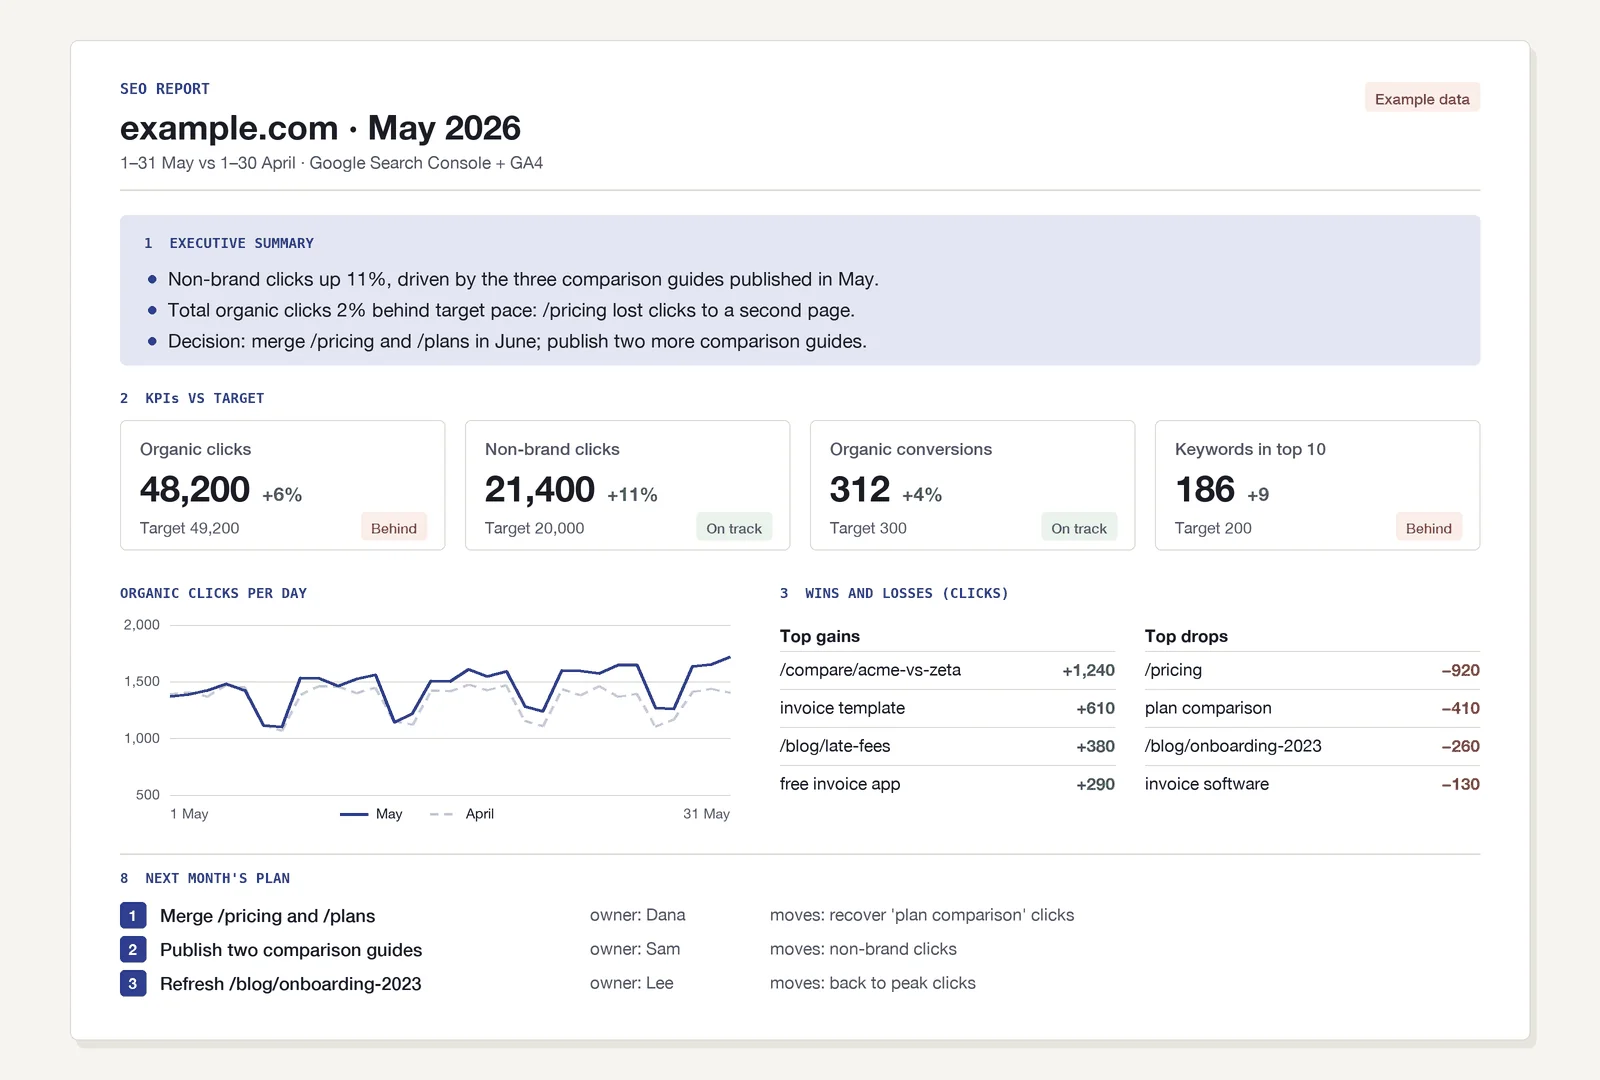 What the template looks like filled in, condensed to one page. Example data.
The monthly SEO report template
Copy this into a doc, a slide or an email. Replace the brackets; delete any line you have nothing honest to say about.
# SEO report: [Site] · [Month YYYY]
Period: [1–30 Month] vs [previous period / same month last year]
Data: Google Search Console (clicks, impressions, CTR, position), GA4 (organic sessions, conversions)

## 1. Executive summary
- [Headline result in one sentence, with the number]
- [Main reason, in one sentence]
- [The one decision or next step that matters most]

## 2. KPIs vs target
| KPI | This period | Previous | Change | Target | Status |
|---|---|---|---|---|---|
| Organic clicks (GSC) | | | | | on track / behind |
| Non-brand clicks (GSC) | | | | | |
| Organic conversions (GA4) | | | | | |
| Keywords in top 3 / top 10 | | | | | |

## 3. Wins and losses
Top 5 keywords or pages that gained clicks: [query/page, change, why]
Top 5 that lost clicks: [query/page, change, why, what we'll do]

## 4. Brand vs non-brand
Brand clicks: [n, change] · Non-brand clicks: [n, change]
[One sentence on what drove the non-brand change]

## 5. Content and pages
New/updated pages this period: [list, with early clicks/impressions]
Pages to refresh: [list, with the drop and the likely cause]

## 6. Technical notes
[Indexing, Core Web Vitals, crawl or migration issues; "None" is a valid answer]

## 7. Actions done
- [Date] [What changed] on [page/section]; result so far: [number or "too early"]

## 8. Next month's plan
1. [Action] · owner: [name] · expected effect: [metric]
2. ...

## 9. Appendix
[Full keyword table, page table, country/device split, notes on data gaps]
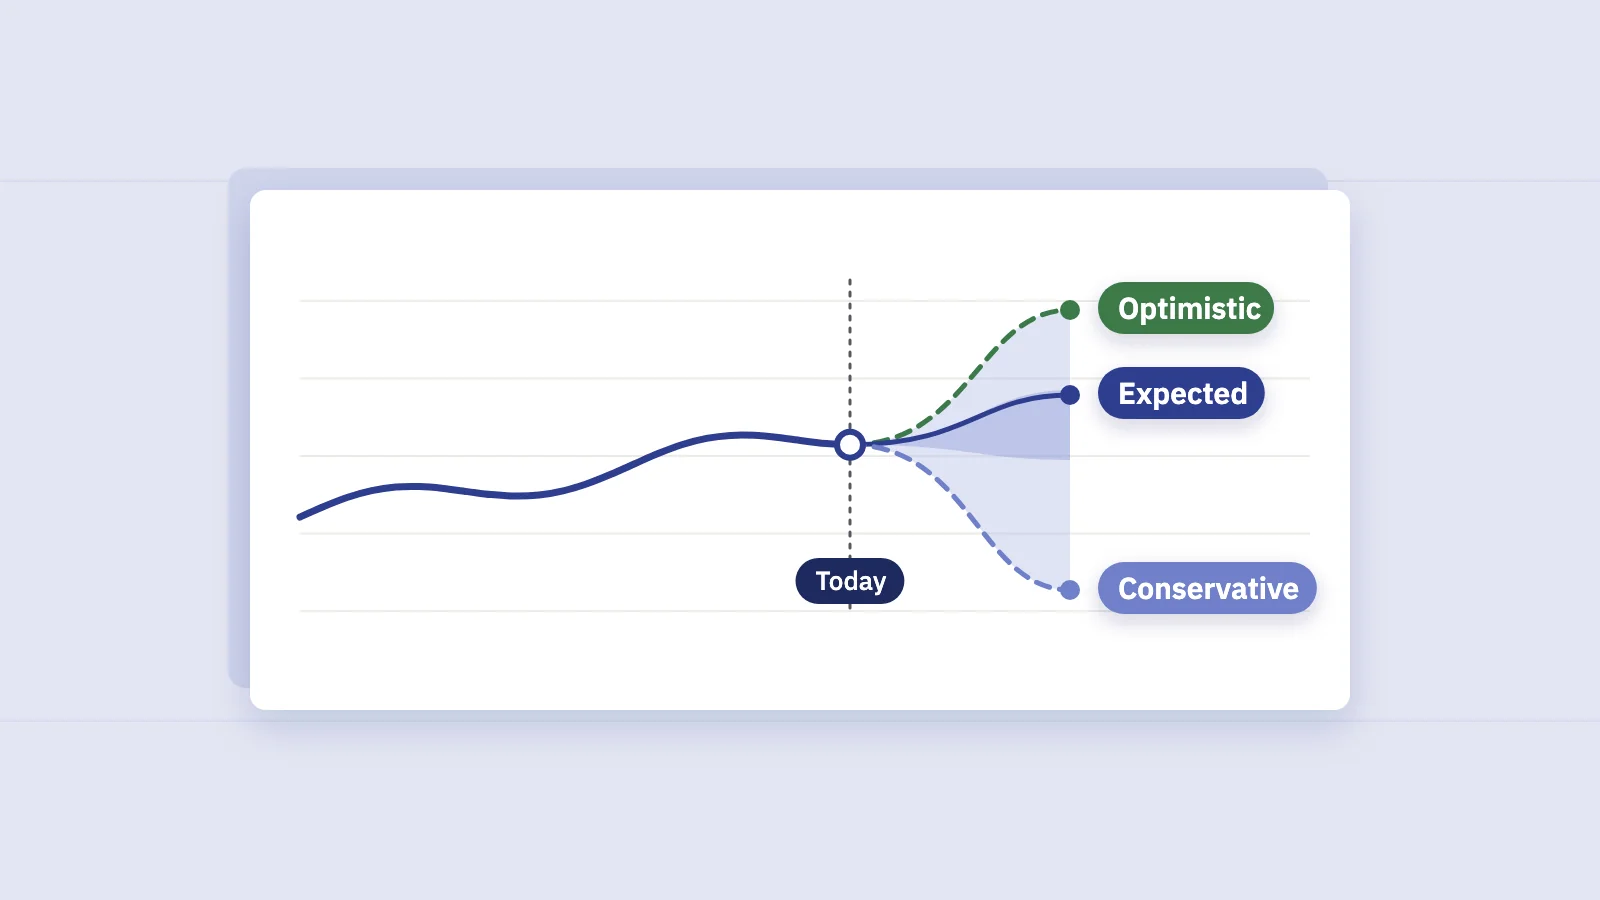
The order follows the flow in the diagram below: the first two sections are the answer, the middle five are the evidence, and the last two turn it into work.
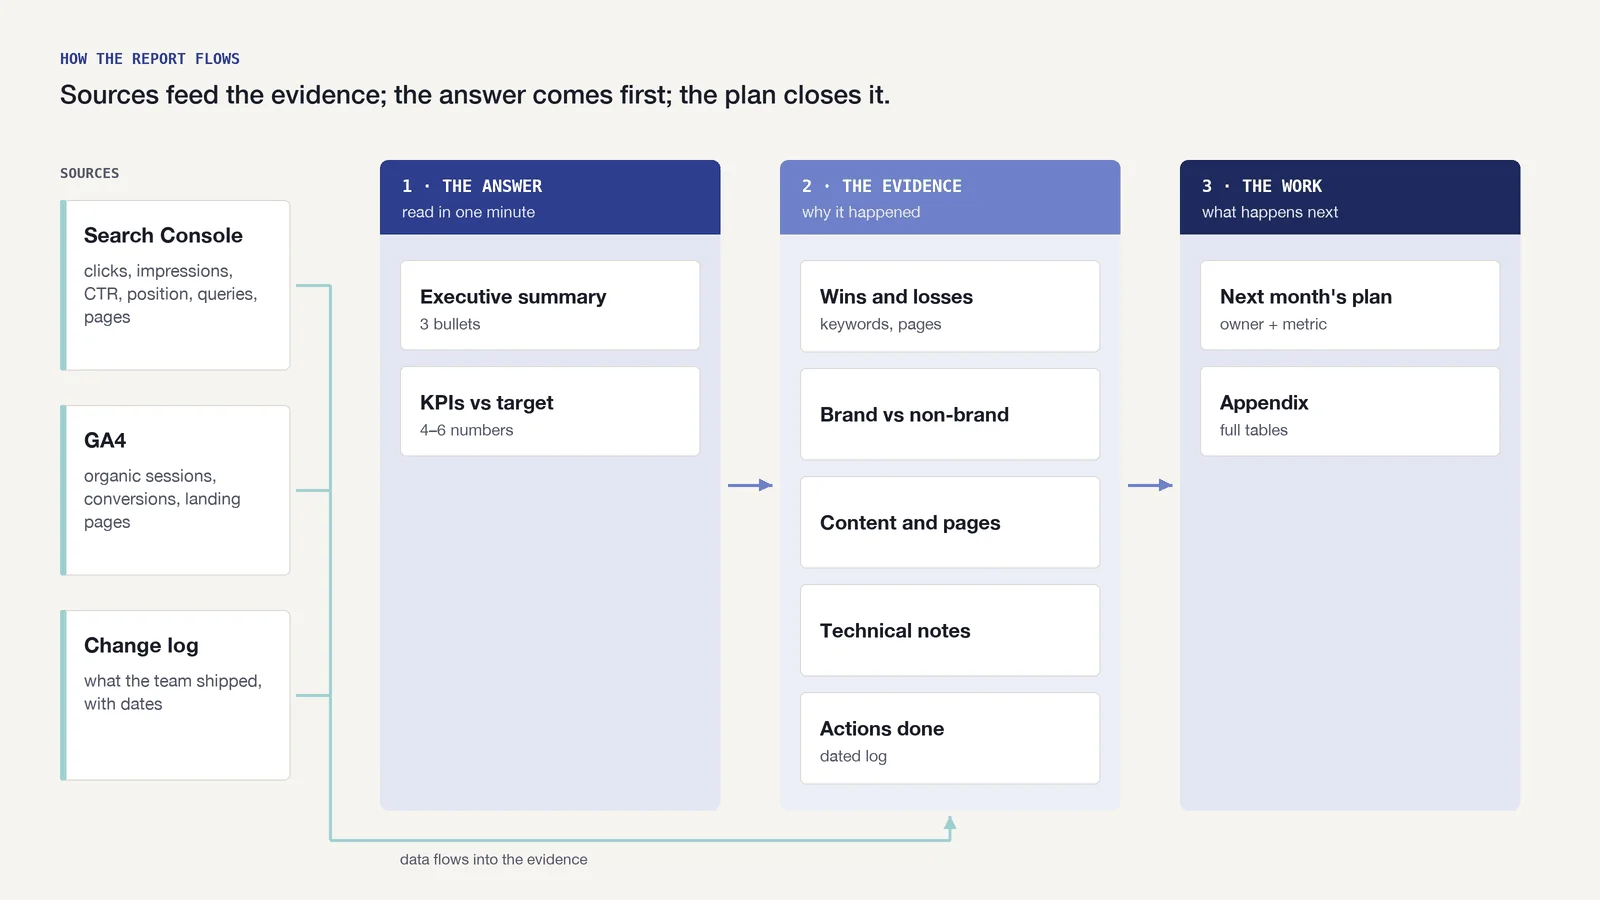 Answer first, evidence second, plan last.
What to put in each section
Every example sentence below uses example numbers. Swap in your own.
1. Executive summary
Three bullets: the result, the reason, the decision. Write it last, after the rest is done. No jargon a manager would have to look up.
- Data: the KPI table and the wins/losses below it.
- Example: "Non-brand clicks rose 14% month over month, mostly from the three comparison guides published in May. We recommend two more guides in June instead of the planned category rewrites."
2. KPIs vs target
Four to six numbers, each with the previous period, the change and the target. A number without a target only tells the reader that it moved, not whether that's good. Pick KPIs the business already cares about; our guide to SEO KPIs covers which ones hold up.
- Data: clicks and impressions from Search Console (Performance > Search results, with the Date filter's Compare tab); organic sessions and conversions from GA4 (Reports > Acquisition > Traffic acquisition, filtered to the Organic Search channel).
- Example: "Organic clicks: 48,200, up 6% on April and 2% behind the quarterly target pace."
3. Wins and losses (keywords and pages)
The five biggest gains and the five biggest drops in clicks, at query or page level, each with a one-line reason. Losses get a next step. Sort by change in clicks, not by position change: moving from 48 to 31 is a big jump that brings almost no traffic.
- Data: Search Console's Queries and Pages tabs with Compare dates on, sorted by the click difference. The UI table exports at most 1,000 rows, so large sites need the API or a tool for the long tail.
- Example: "/pricing lost 22% of its clicks after a second page started ranking for 'plan comparison'. We'll merge the two pages next week." (If two URLs keep swapping, see keyword cannibalization in Search Console.)
4. Traffic by brand vs non-brand
Brand clicks mostly follow brand awareness, ads and PR. Non-brand clicks are where SEO work shows. Reporting them together hides both.
- Data: Search Console's Query filter now offers Branded and Non-branded options, announced on the Search Central blog. It isn't available for sub-properties or sites with few impressions; there, use a Query filter that excludes your brand terms (custom regex covers misspellings).
- Example: "Brand clicks were flat (−1%); non-brand clicks grew 11%, led by 'invoice template' queries."
5. Content and pages
What was published or updated, how it's doing so far, and which older pages are fading. New pages need a few weeks before their numbers mean much, so report impressions for them and say so.
- Data: Search Console filtered to each page; GA4 Landing page report (Reports > Engagement > Landing page) for engagement and conversions.
- Example: "The four guides published in May reached 31,000 impressions and 900 clicks. The 2023 onboarding guide is down 40% from its peak and is first on the refresh list."
6. Technical notes
Only what affects search: indexing changes, Core Web Vitals, crawl errors, redirects, a migration. "No issues found" is a fine line and better than padding.
- Data: Search Console's Pages (indexing) and Core Web Vitals reports, plus your crawler.
- Example: "1,200 filter URLs moved to 'Excluded by noindex' after the template fix, as intended. No change in indexed product pages."
7. Actions done
A dated log of what the team changed, with the effect so far. This section is how a reader connects work to results, so keep it factual and note when it's too early to tell.
- Data: your task tracker or change log, plus before/after clicks for the affected page.
- Example: "May 6: rewrote titles on 12 category pages. Average CTR on those pages went from 2.1% to 2.9% over the following three weeks."
8. Next month's plan
Three to five actions, each with an owner and the metric it should move. If the plan doesn't follow from the wins and losses above, something is missing.
- Example: "Merge /pricing and /plans (owner: Dana) to recover 'plan comparison' clicks; expect the effect in four to six weeks."
9. Appendix
The full tables, country and device splits, and notes on data quirks. Search Console keeps 16 months of data and withholds some rare queries for privacy, so query totals won't add up to page totals. Say that once here instead of answering it every month.
Variants: clients vs internal, weekly vs quarterly
The same nine sections work for every audience. What changes is depth and tone.
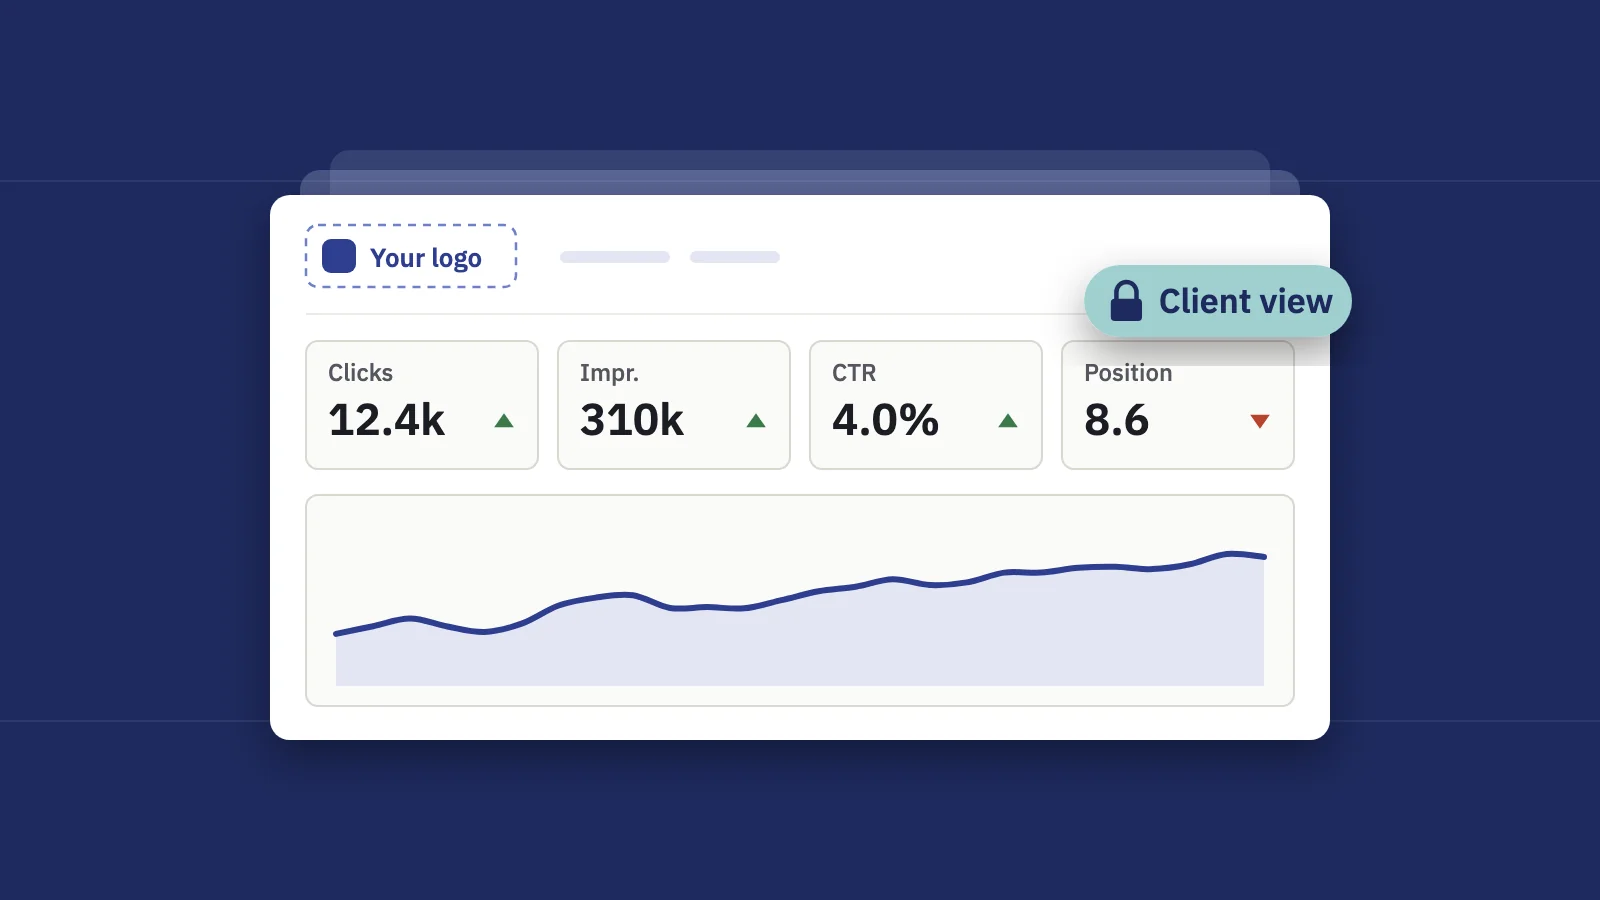
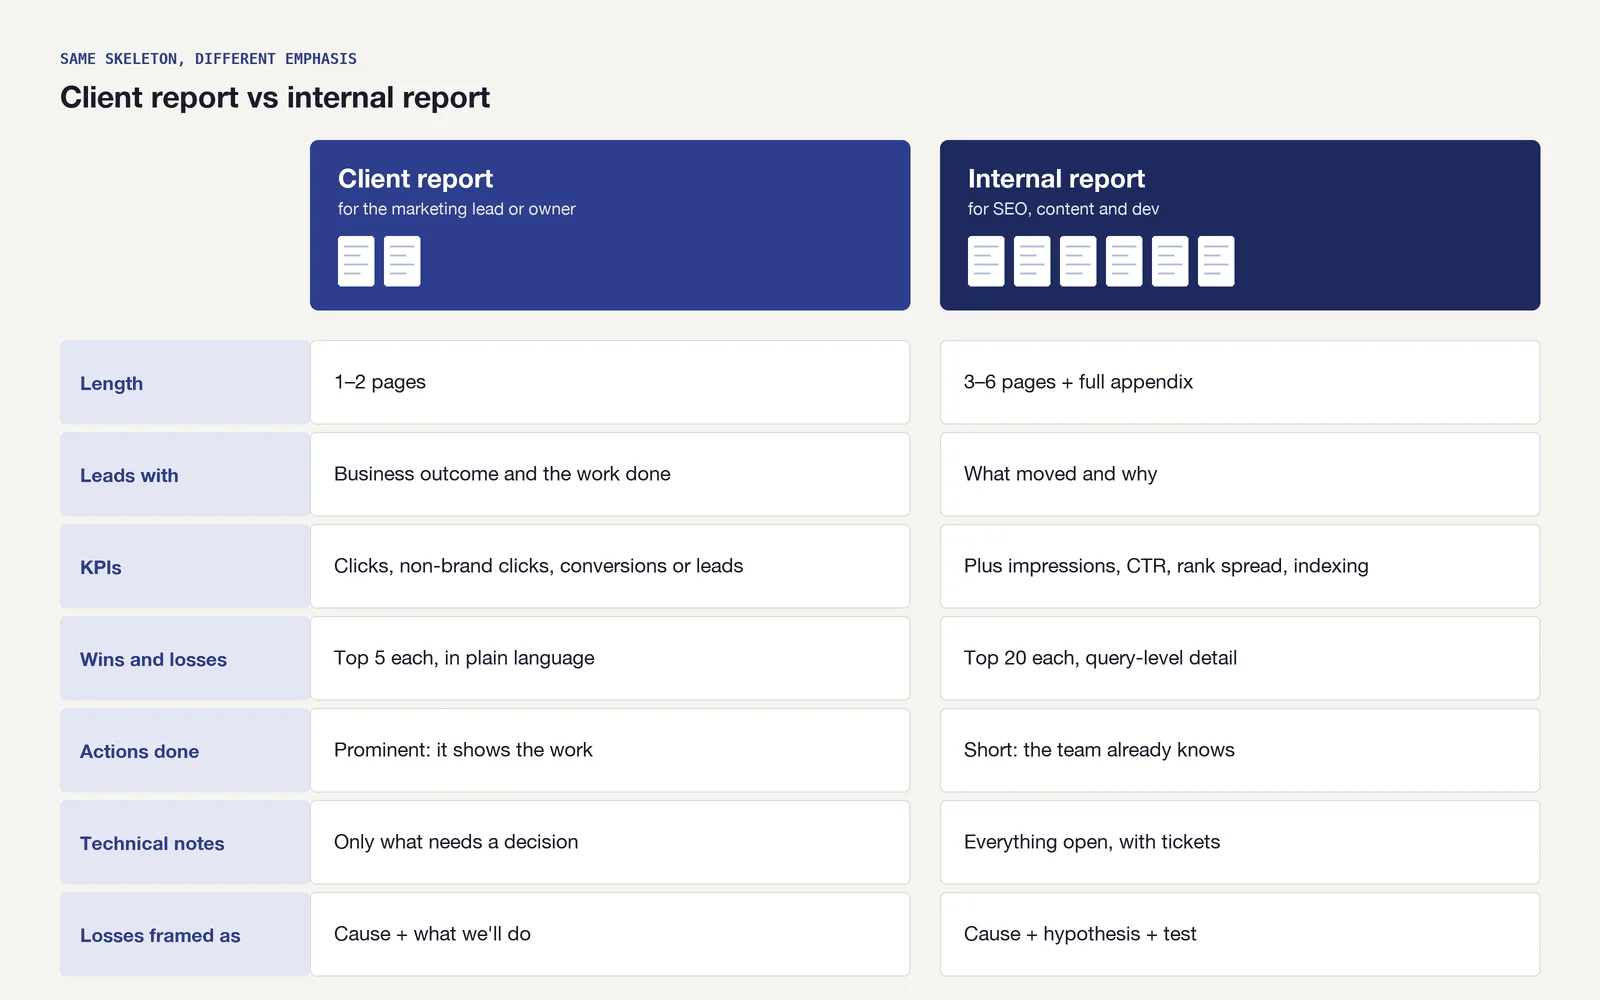 Same skeleton, different emphasis.
| Client report | Internal report | |
|---|---|---|
| Reader | Marketing lead or owner, often non-technical | SEO team, content, dev, product |
| Lead with | Business outcome and the work you did | What moved and why |
| KPIs | Clicks, non-brand clicks, conversions or leads | Plus impressions, CTR, position spread, indexing |
| Wins and losses | Top 5 each, plain language | Top 20 each, with query-level detail |
| Actions done | Prominent: it shows the work | Short: the team already knows |
| Technical notes | Only what needs a decision | Everything open, with tickets |
| Appendix | Optional | Full tables |
Frequency changes the job of the report:
| Weekly | Monthly | Quarterly | |
|---|---|---|---|
| Purpose | Catch problems early | Track progress, plan next month | Review strategy and targets |
| Length | 5–10 lines | 1–3 pages | A deck or long doc |
| Sections | KPIs, biggest movers, anything broken | All nine | All nine, plus year-over-year and next quarter's targets |
| Compare with | Previous week | Previous month and last year | Same quarter last year |
Weekly numbers are noisy: a holiday or a single news spike can swing them. Use them for alerts, not for conclusions. Search Console data also lags by a couple of days, so a weekly report sent on Monday covers a week that ended a few days earlier.
Common mistakes
- Leading with rankings. Average position is easy to misread: it gets worse when you start appearing for new, harder queries, even while clicks grow. Lead with clicks and conversions.
- No comparison. "40,000 clicks" means nothing alone. Compare with the previous period and, for seasonal sites, the same period last year.
- Mixing brand and non-brand. A TV campaign can make SEO look brilliant for a month.
- Reporting what changed but not why. Every big movement deserves one sentence of explanation, even if it's "Google update, we're watching."
- Hiding losses. Clients find them anyway. A loss with a plan builds more trust than a report with only green numbers.
- Different numbers from Search Console. If your report doesn't match what the client sees in their own property, you spend the meeting reconciling instead of planning.
- Too many charts. If a chart doesn't change a decision, move it to the appendix.
How to automate the report
Filling the template by hand takes an afternoon a month per site. Most of that is pulling the same numbers in the same order, which is exactly what tools should do.
- Fix the template first. Decide the sections, KPIs and targets once. Automating a report nobody reads only makes it arrive faster.
- Pull the data automatically. Looker Studio has free connectors for Search Console and GA4. It's flexible, but you build and maintain every chart yourself.
- Keep the writing human. The executive summary, the reasons and the plan are the part a reader pays for. Block 30 minutes for them; automate everything else.
- Schedule delivery. Send on the same day each month, to the same people, in the same format.
In Serplyze, the SEO report generator covers steps 2 and 4 from your Search Console data: you pick sections (summary KPIs, brand vs non-brand, top movers, top pages and queries, content findings, cannibalization, targets, actions with their before/after impact and Google updates among them), add a cover page and your own executive summary, and the report goes out daily, weekly or monthly as an email with a PDF, or as a read-only link. For agencies, the Agency add-on sends white-label scheduled reports under your name, and its client portal gives each client a read-only login to their own sites between reports. To report on one part of a site, such as the blog or a category, limit a section to a content group.
Whatever tool you use, keep the same sections in the same order every month. Readers learn where to look, and month-to-month changes jump out.
Key takeaways
- Order the report as answer, evidence, plan: summary and KPIs first, appendix last.
- Every KPI needs a comparison and a target; every big movement needs a one-line reason.
- Split brand from non-brand; Search Console's Branded/Non-branded Query filter makes it quick.
- Client reports emphasize outcomes and work done; internal reports go deeper on detail.
- Automate the data pulling and delivery; write the summary and plan yourself.
Want the numbers filled in for you? Create a free Serplyze account, connect Search Console, and generate your first report from the template above in a few minutes.