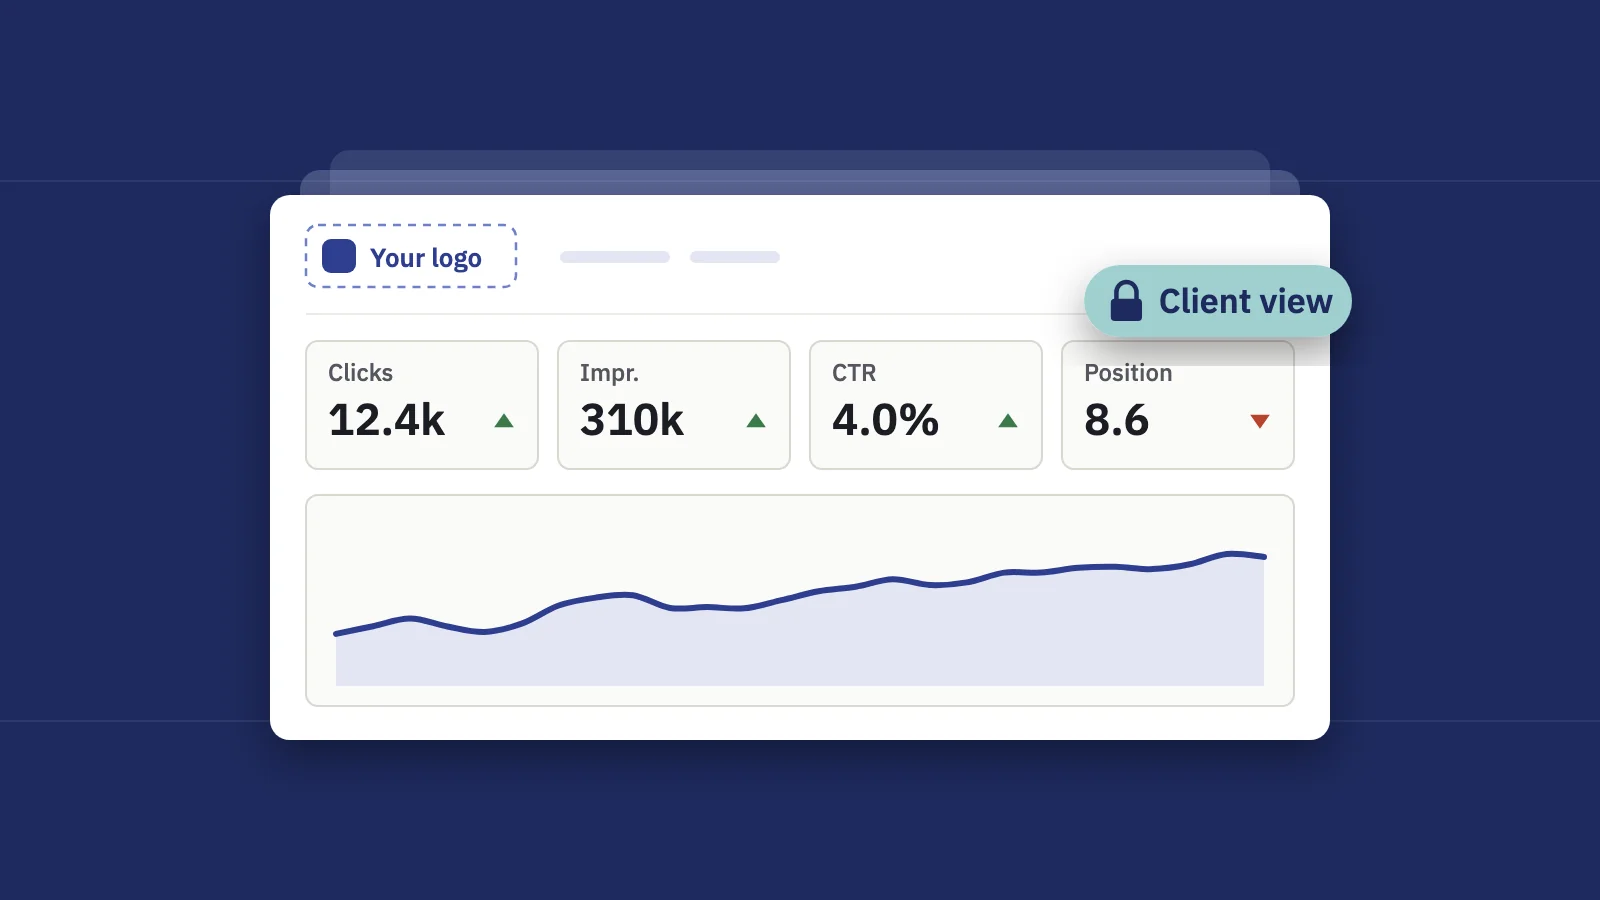
A client dashboard has one job: let the client answer "is SEO working for us?" in under a minute, without calling you. Most fail because they show everything the tool can measure instead of the few numbers the client cares about. Here is what to put on it, in what order, what to leave off, and how to keep each client in their own lane.
What clients actually look at, and in what order
Watch a client open an SEO dashboard and the path is nearly always the same. They aren't analysts, and they read it the way they read a bank statement: the total first, then whether it went up, then anything that looks wrong.
- The headline number and its direction. Organic clicks for the period and the change. If it has a target next to it, they check whether they're on track.
- Something that means money. Conversions, leads or revenue from organic search. This is the number their boss asks them about.
- The trend line. Is this month a blip or part of a direction? Sixteen months beats thirty days, because it shows last year's same season.
- Anything red. A drop, a lost keyword, a section going down. They look for the bad news on purpose.
- What you did. The work you shipped this period, and whether it moved anything.
Everything after that is optional. Design the dashboard so that this path runs top to bottom and left to right, and the client never has to scroll to finish it.
The 8 tiles worth showing
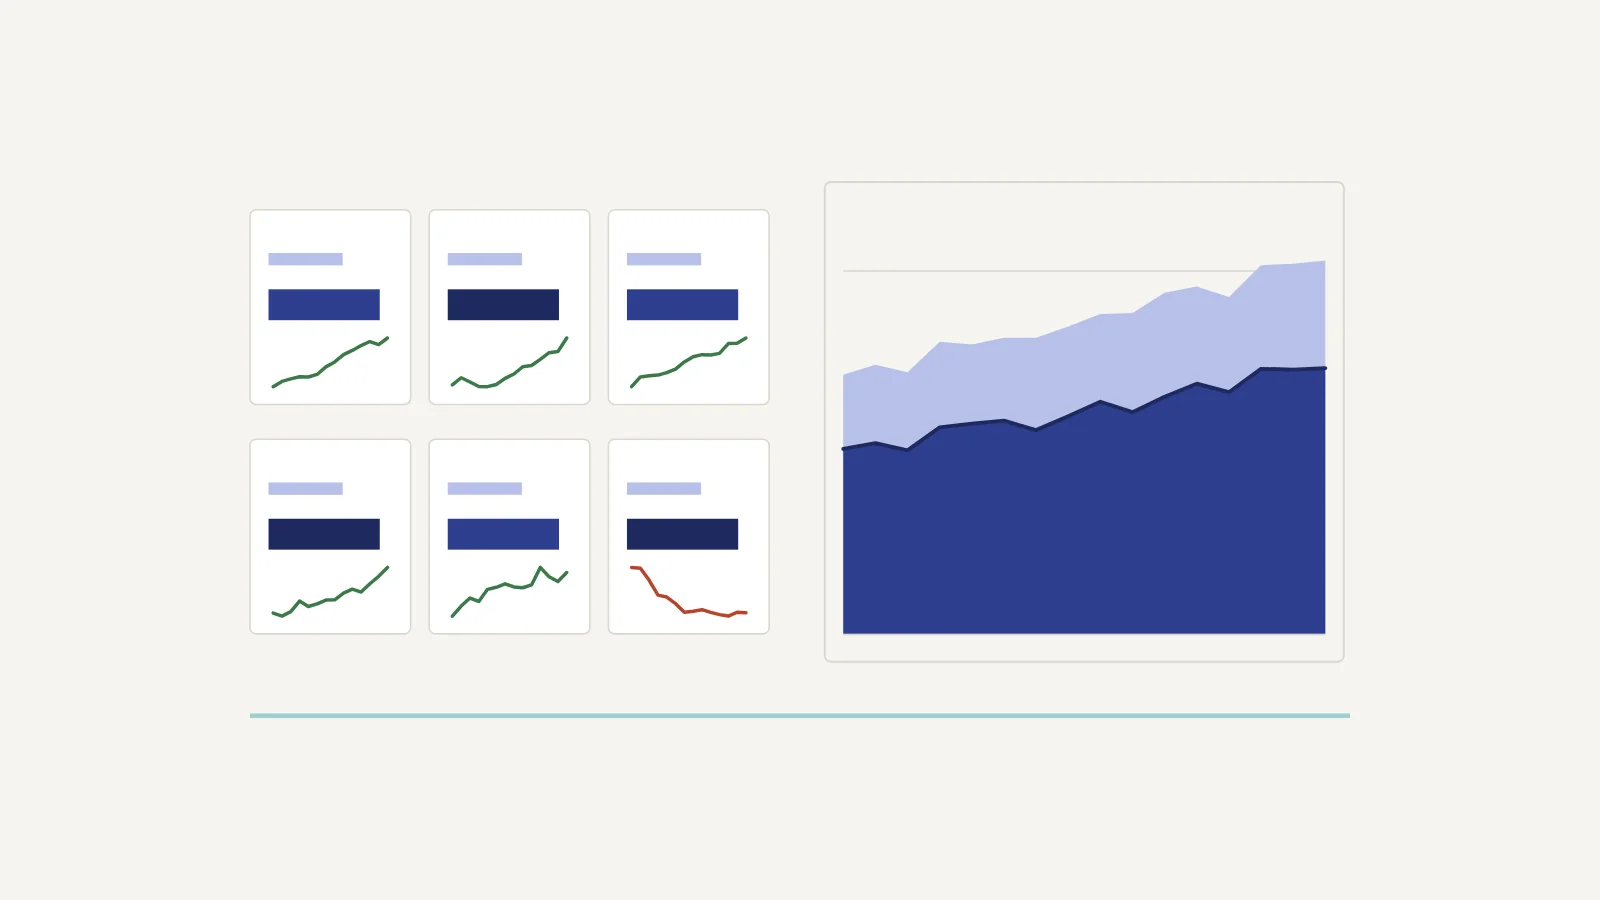
Eight tiles is enough to answer the five questions above and few enough to fit on one screen. Six works for a small site; skip the section tile and the movers if they would be mostly empty.
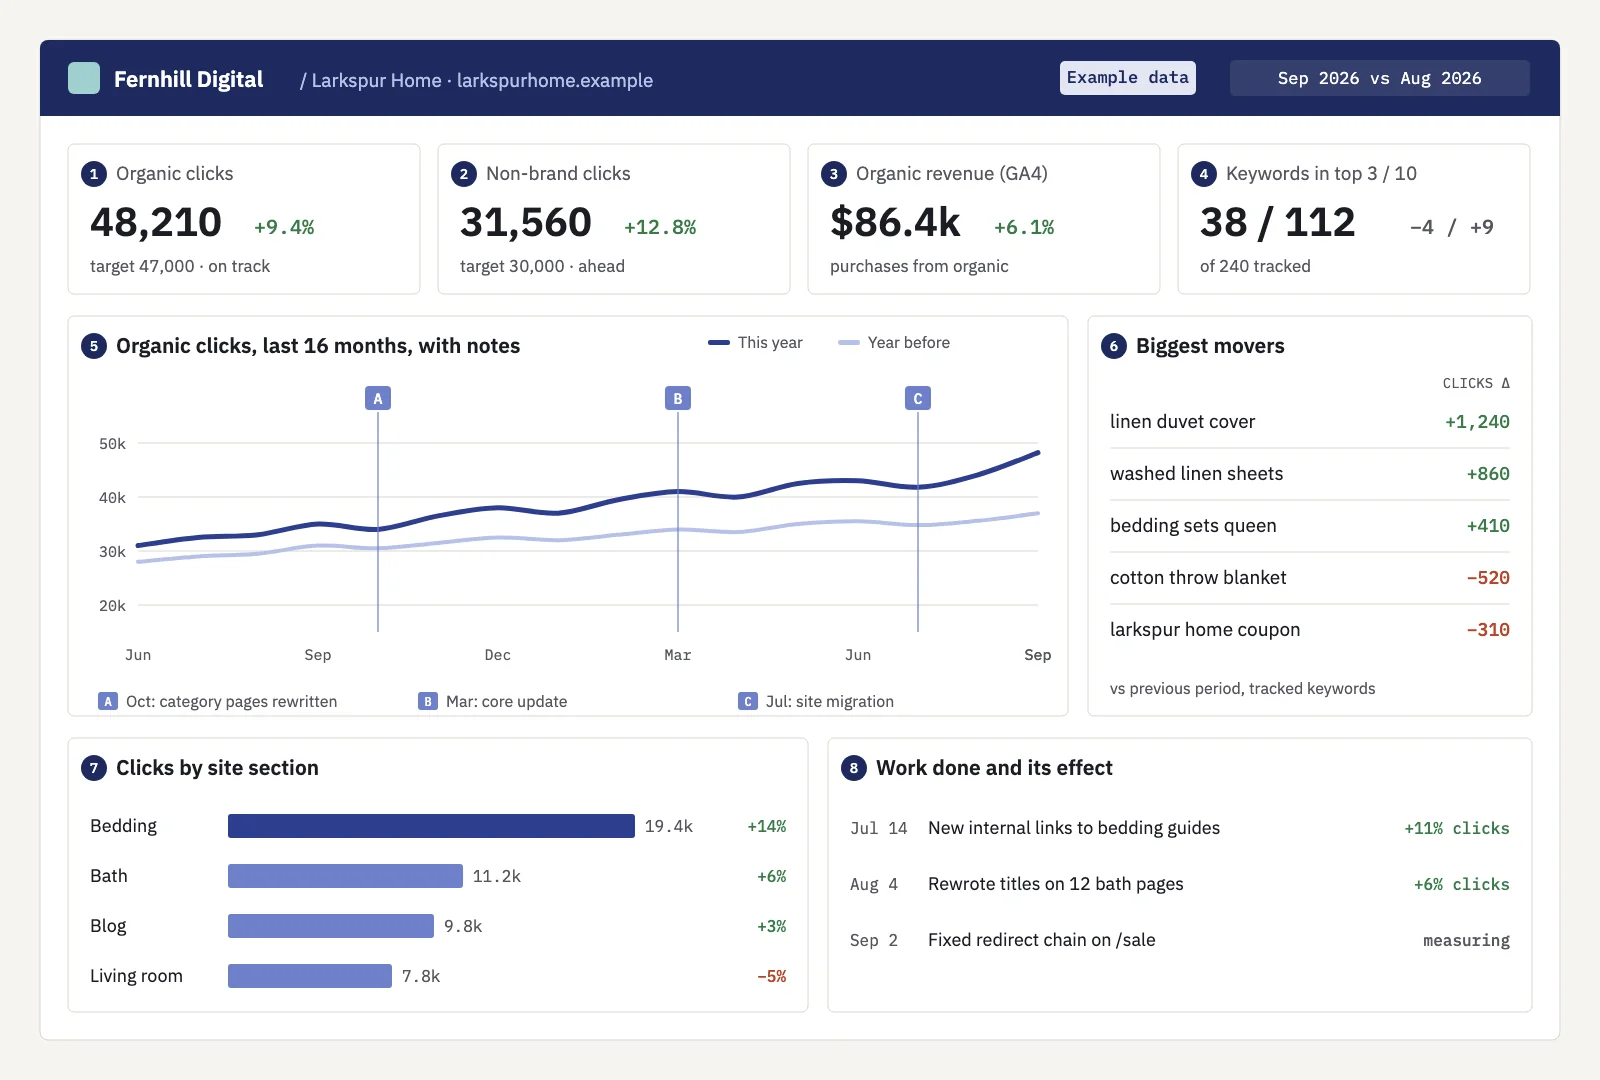 Eight tiles, in reading order. Example data for a fictional brand.
| # | Tile | Source | Why the client cares |
|---|---|---|---|
| 1 | Organic clicks vs target | Search Console | The headline: visits from Google, against the goal you agreed |
| 2 | Non-brand clicks | Search Console | Growth that SEO work caused, not people already searching the brand |
| 3 | Organic conversions or revenue | GA4 | What the traffic is worth to the business |
| 4 | Keywords in top 3 / top 10 | Rank tracking on Search Console data | Rankings as a count the client can follow month to month |
| 5 | 16-month trend with notes | Search Console | Direction and seasonality, with launches and updates marked |
| 6 | Biggest movers | Search Console | Five gains and five losses, so nothing bad is hidden |
| 7 | Clicks by site section | Search Console, grouped by URL | Which part of the site is growing: products, blog, locations |
| 8 | Work done and its effect | Your change log | Proof that the retainer pays for actual changes |
A few notes on the choices:
- Brand vs non-brand is the tile that changes the conversation. Total clicks can rise because a TV campaign made more people search the company name. Non-brand clicks are the part SEO can claim. Our guide to branded vs non-branded traffic covers how to split them.
- Targets belong on the tiles. "48,210 clicks, +9%" invites the question "is that good?". "48,210 against a target of 47,000" answers it. The SEO KPIs guide goes through which metrics hold up as targets.
- Revenue needs GA4. Search Console counts clicks, not sales. If the client has no ecommerce tracking or conversion events, show leads or form submissions, or leave the tile off rather than guessing.
What to hide
The urge is to show everything, because everything is available. Each extra tile is one more thing the client can misread, and one more question on the next call.
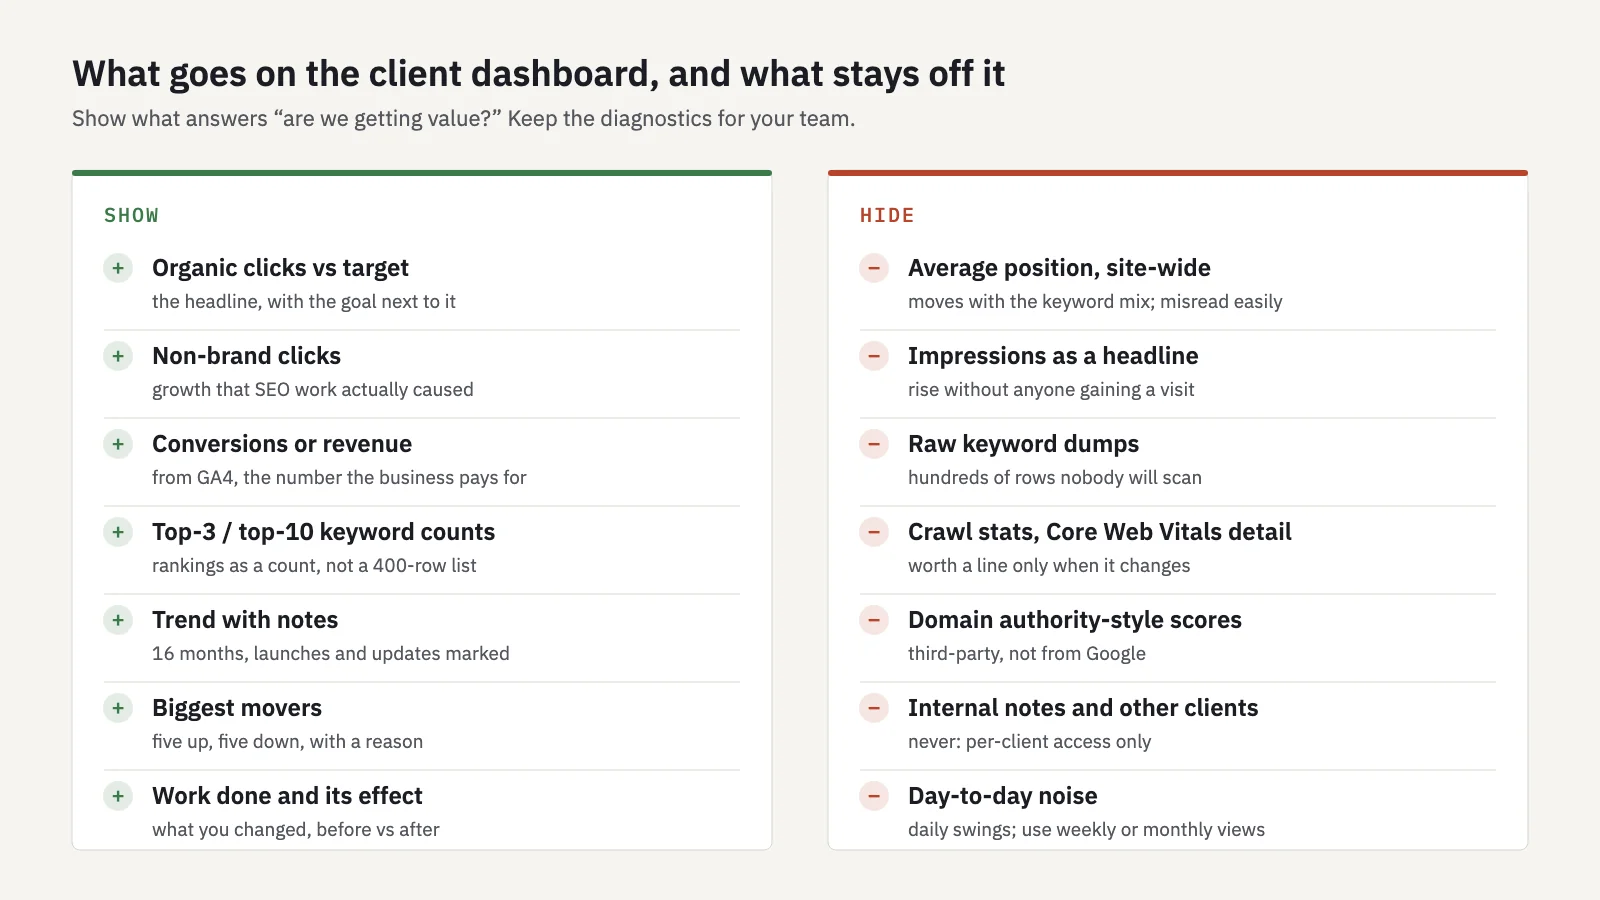 Show what answers "are we getting value?". Keep the diagnostics for your team.
The ones that cause the most trouble:
- Site-wide average position. It moves with the keyword mix. When a site starts ranking on page 3 for hundreds of new queries, the average gets worse while traffic grows. Clients read "position went from 14 to 19" as failure. See average position in Search Console for why.
- Impressions as a headline. Impressions can climb because Google shows the site for more searches, or because an AI Overview sits above the result and nobody clicks. Keep impressions in your own analysis and put clicks on the dashboard.
- Raw keyword tables. A 400-row list tells the client you track a lot of keywords and nothing else. Show counts in the top 3 and top 10, plus the movers.
- Technical detail. Crawl stats and Core Web Vitals belong on the dashboard only when they change something: a migration, a big indexing drop. Otherwise one line in the monthly report is enough.
- Third-party authority scores. They don't come from Google, they differ between tools, and clients start chasing them.
Live dashboard vs monthly report
A dashboard doesn't replace the report. They do different jobs, and clients who get only one of them end up asking for the other.
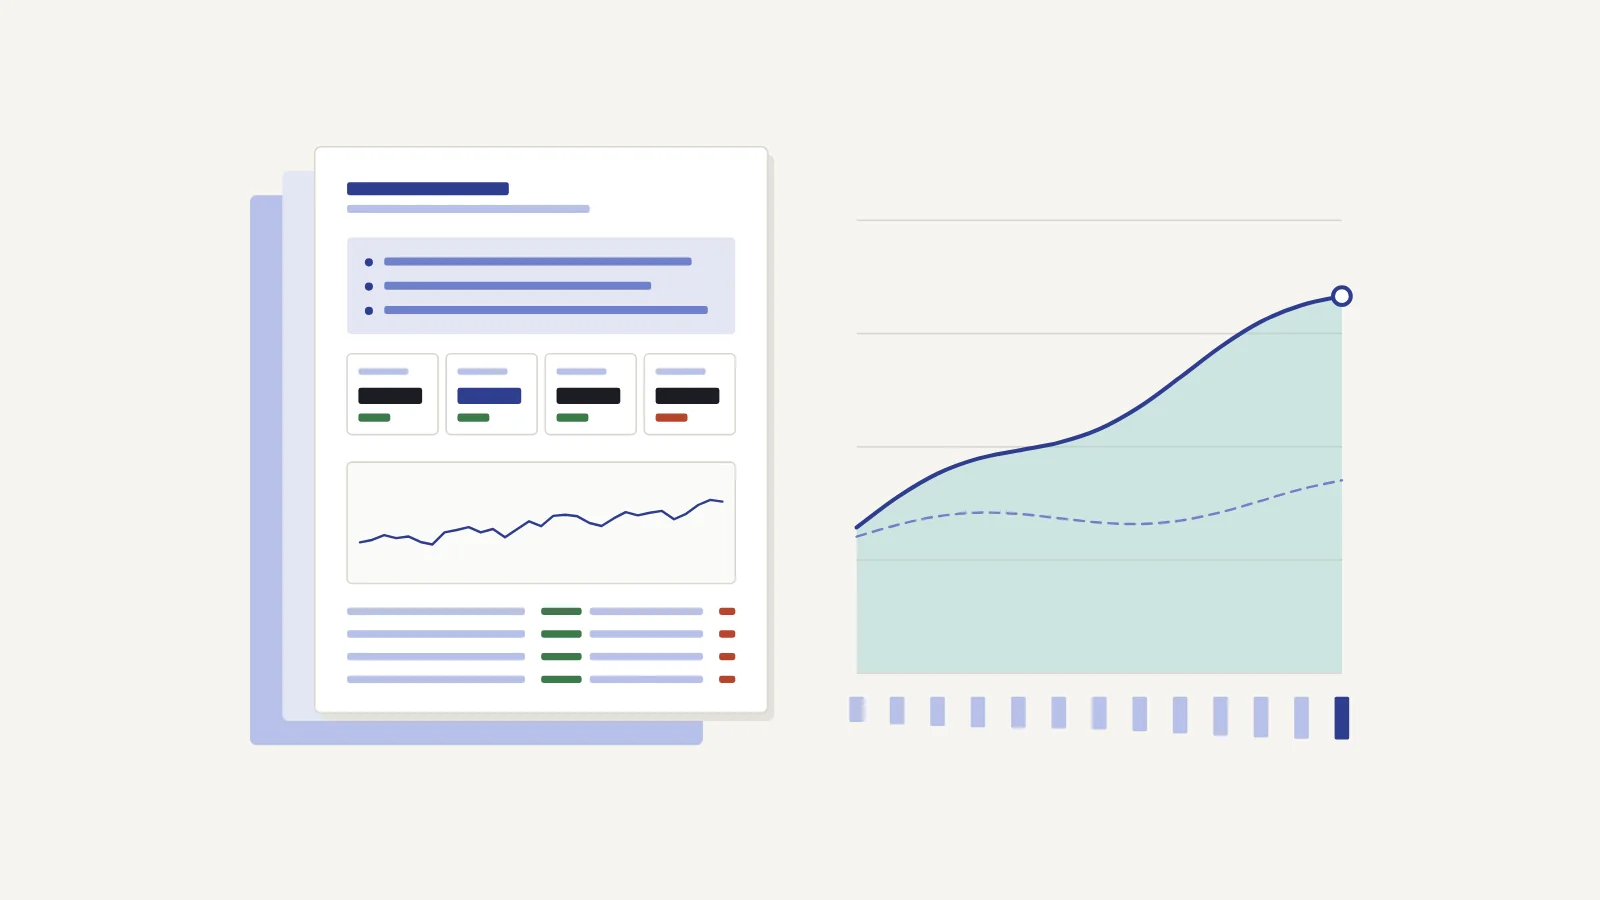
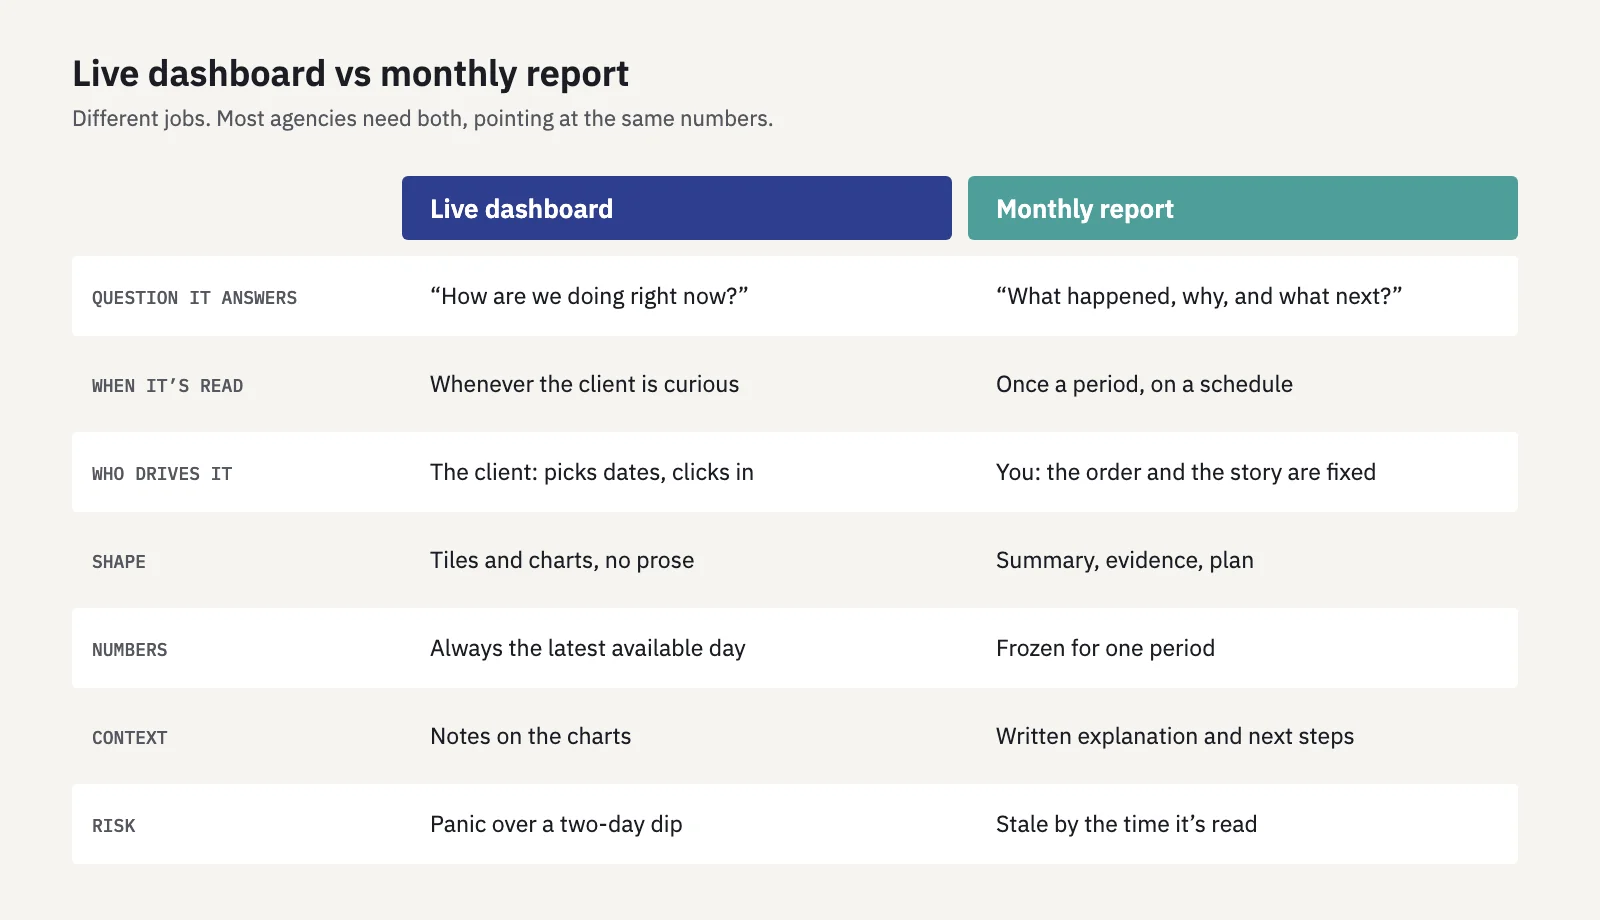 Same numbers, different jobs.
The dashboard is for "how are we doing right now?". The client opens it when they're curious, picks a date range and clicks into a page. The risk is that they see a two-day dip and email you in a panic. Search Console data also runs a few days behind, so the last days on a live chart are often incomplete.
The report is for "what happened, why, and what next?". You decide the order and write the explanation. The risk is that it's stale by the time it arrives, and that it can't answer the follow-up question.
Use both, built on the same source, so the numbers agree. The SEO report template covers the monthly side. On the dashboard, default to the last full month compared with the month before, not "last 7 days", so the first thing the client sees is a settled number.
Access and permissions: one client, one view
This is the part that can lose you a client. An agency dashboard with every client on it is fine for your team. A client who can see another client's brand, even just its name in a dropdown, is a breach of trust and possibly of contract.
- Give each client their own login, not a shared one. Shared passwords get forwarded, and you can't tell who saw what.
- Grant access per project. The client sees the sites you picked, and nothing else exists for them: not in menus, not in totals, not in search.
- Make it read-only. Clients shouldn't be able to change keywords, groups, targets or alert rules. If they want a change, it should come through you.
- Check emails and exports too. Scheduled reports, alert digests and exports leak just as easily as screens. Each recipient should only receive data for the projects they can open.
- Watch screen sharing. On a call, your own dashboard with twenty clients on it is one tab away. Hide everything except the client you're talking to before you share.
If you build the dashboard yourself, in Looker Studio or a spreadsheet, you manage report sharing and data source credentials separately, which is easy to get wrong; the safest setup is one copy per client. On the Search Console side, Google lets property owners add users as full or restricted users; a restricted user gets view rights on most data, which is the right level for anyone who only needs to read.
Serplyze's client portal handles this with a read-only Client role: you choose the projects each client may see, and the restriction is enforced in the database for every query, not only hidden in the interface. Report recipients only receive projects they have access to, and meeting mode masks every other client's name, domain and numbers while you share your screen. The portal and meeting mode come with the Agency add-on, available on any paid plan.
White-labelling
White-labelling means the client sees your agency, not your tool vendor. In practice that's a short list:
- Your logo and brand colour in the dashboard header.
- No vendor logo or "made with" footer on the dashboard, shared links or PDFs.
- Report emails that show your agency as the sender, with replies going to you.
- One layout you can copy across clients, so twenty clients get the same structure with their own data.
Ask two questions before you pay for it. Does the white-labelling cover every surface the client sees (dashboard, link, PDF, email), or only some of them? And does it run on a custom domain, or on the vendor's? A dashboard on the vendor's domain under your logo is common, and most clients don't mind, but know which one you're getting.
In Serplyze, scheduled reports carry your logo and colour on paid plans. Removing Serplyze branding from reports, PDFs and share links, and sending report emails under your agency's name, needs the Agency add-on. The portal shows your logo and colour in its header and runs on Serplyze's domain; a custom domain isn't available.
How to annotate changes
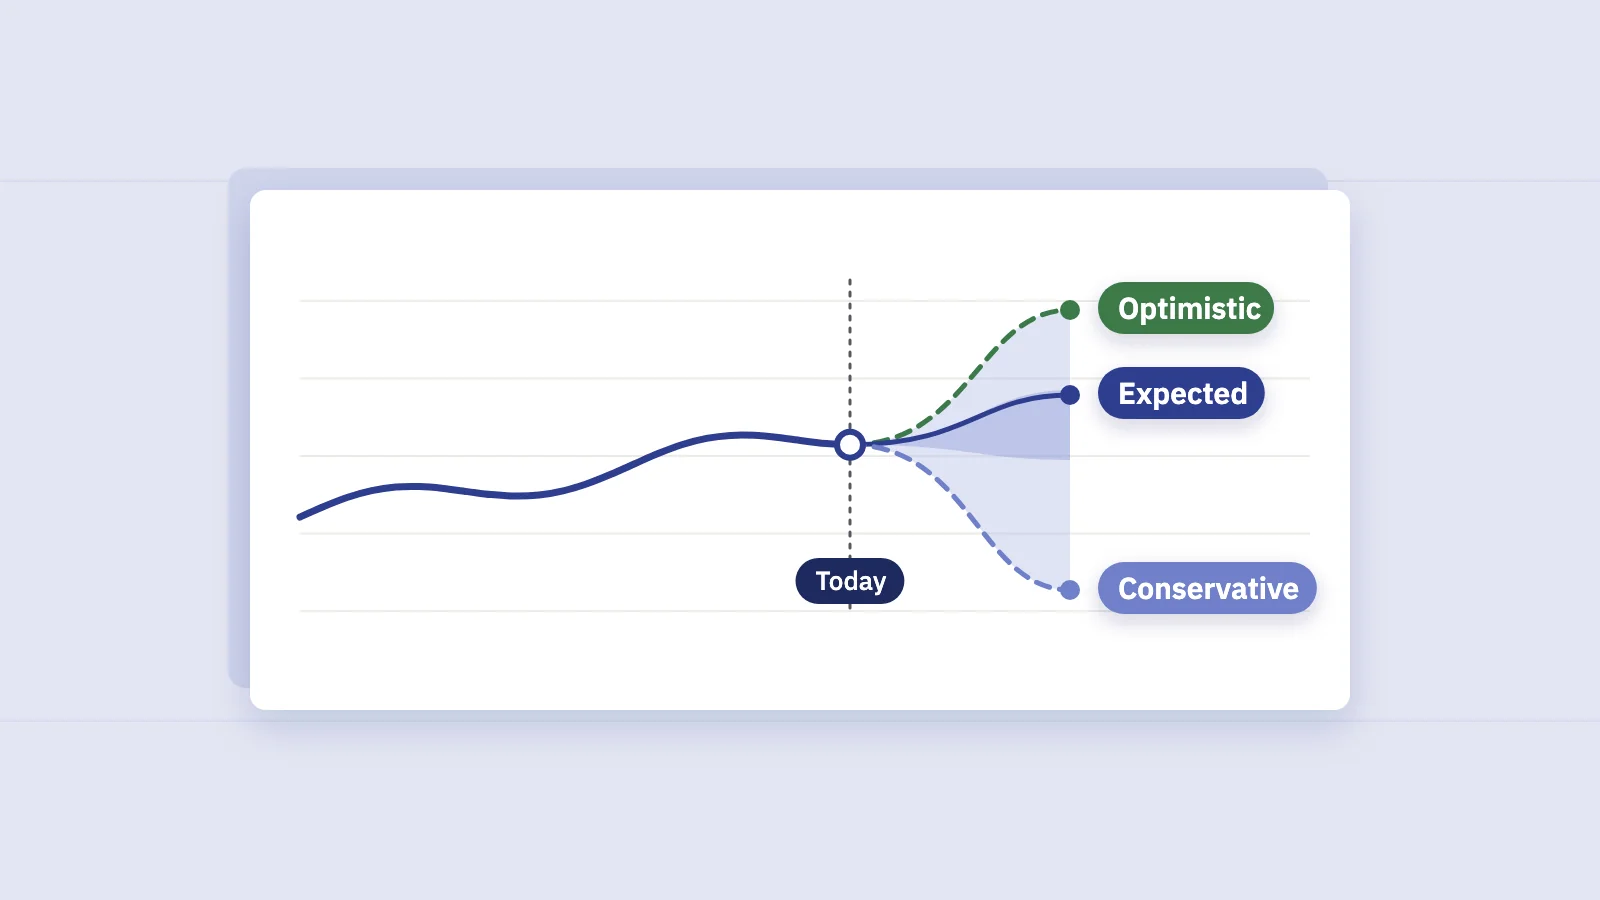
A chart without notes forces the client to guess. When clicks jump in March, they'll credit whatever they remember: their new ad campaign, the redesign, you. Notes on the chart settle it before anyone asks.
Annotate four kinds of event:
- Your work: a title rewrite, new internal links, a content refresh, a technical fix. Date it the day it went live, not the day you started.
- The client's changes: a migration, a redesign, a new product range, a price change, a TV campaign.
- Google's changes: core and spam updates. Google lists them with dates on the Search Status Dashboard's ranking history.
- Tracking changes: a new GA4 property, a consent banner, a switch from http to https or a new domain property in Search Console.
Keep each note to one line and say what happened, not what you hope it did: "Jul 14: internal links from bedding guides to 12 product pages", not "SEO improvements". For your own work, add the result once there's enough data to compare: the 28 days after the change against the 28 days before, next to the whole site's change in the same weeks so a seasonal swing isn't credited to you. That's still correlation, not proof, and the note should say so if the client is likely to read it as proof.
Not every note is for the client. "Client delayed the migration again" belongs in your notes, not on their chart. Serplyze's chart notes have a "visible to client" switch, and reports, share links and PDFs only print the visible ones. Google's ranking updates are marked on report charts automatically, and logged actions show their before/after impact (actions are on paid plans).
Common mistakes
- Building for the analyst, not the reader. If the person reading is a marketing director, the dashboard needs fewer numbers and more targets.
- Defaulting to "last 7 days". The newest days are incomplete in Search Console, so the dashboard opens on a fake drop.
- Showing totals without a comparison. Every number needs the previous period or the same period last year next to it.
- Hiding the losses. Clients find them anyway, usually in their own Search Console, and then trust the rest less.
- Mixing sources that disagree. If the dashboard says 48,000 clicks and the client's Search Console says 45,000, you'll spend the call explaining the difference instead of the results. Use the same source the client can check.
- One login for the whole client team. Use personal logins so you can remove someone who leaves.
- Forgetting the screen share. The most common leak isn't a permission bug. It's an agency dashboard shared on a call.
Key takeaways
- Clients read in a fixed order: headline number, money, trend, bad news, your work. Lay the dashboard out in that order.
- Six to eight tiles: clicks vs target, non-brand clicks, conversions or revenue, top-3/top-10 counts, a 16-month trend with notes, movers, sections, and work done.
- Hide site-wide average position, impressions as a headline, keyword dumps and third-party scores.
- Use a live dashboard and a monthly report together, on the same data source.
- Give each client a personal, read-only login limited to their own projects, and check that emails, exports and screen shares follow the same rule.
- Annotate your work, the client's changes and Google's updates, and keep internal notes internal.
Serplyze gives each client a read-only, branded view of their own Search Console data, with reports and chart notes built on the same numbers. Start free and connect Search Console in about five minutes.