Most SEO reports track too many numbers and too few outcomes. Here are 10 SEO KPIs that tie to traffic and revenue and can be measured from Search Console and GA4, each with how to measure it, why it matters and the trap to avoid.
What makes a metric a KPI
A KPI is one of the few metrics you agree to be judged on. For SEO, a metric earns that place when it passes three tests:
- It ties to an outcome. If the number goes up, the business gets more qualified visits, leads or revenue.
- It is measured reliably. You can pull it the same way every month from first-party data.
- SEO work can move it. A metric that mostly follows ad spend is not an SEO KPI.
Branded searches often fail the third test: someone searching your company name was already going to find you. That is why most of the list below splits branded from non-branded traffic.
The 10 SEO KPIs
| # | KPI | Source | Report it |
|---|---|---|---|
| 1 | Non-brand clicks | Search Console | Monthly, with trend |
| 2 | Impression share of a keyword group | Search Console + keyword tool | Quarterly |
| 3 | Weighted position for tracked keywords | Search Console | Monthly |
| 4 | Top-3 and top-10 keyword counts | Search Console | Monthly |
| 5 | CTR vs expected CTR by position | Search Console | Monthly, as a work list |
| 6 | Pages with clicks | Search Console | Monthly |
| 7 | Content decay count | Search Console | Quarterly |
| 8 | Organic key events and revenue | GA4 | Monthly |
| 9 | AI Overview exposure | Search Console (estimated) | Quarterly |
| 10 | Share of voice in a keyword group | Search Console or rank data | Quarterly |
1. Non-brand clicks
What it is. Clicks from Google Search on queries that don't contain your brand name, product names or common misspellings of them.
How to measure it. In Search Console, open Performance > Search results, click "+ Add filter", choose Query, and exclude your brand terms. A "Custom (regex)" query filter handles several spellings at once, for example acme|acmee|acme corp. On eligible sites Google now also offers a branded queries filter that classifies queries for you. It only works on top-level properties with enough search volume.
Why it matters. Non-brand clicks are the people who found you because of your content, not because they already knew you. This is the headline number for SEO.
Common trap. Search Console hides rare queries for privacy, so your non-brand figure covers named queries only. Never get it by subtracting brand clicks from the site total: that counts every anonymized click as non-brand.
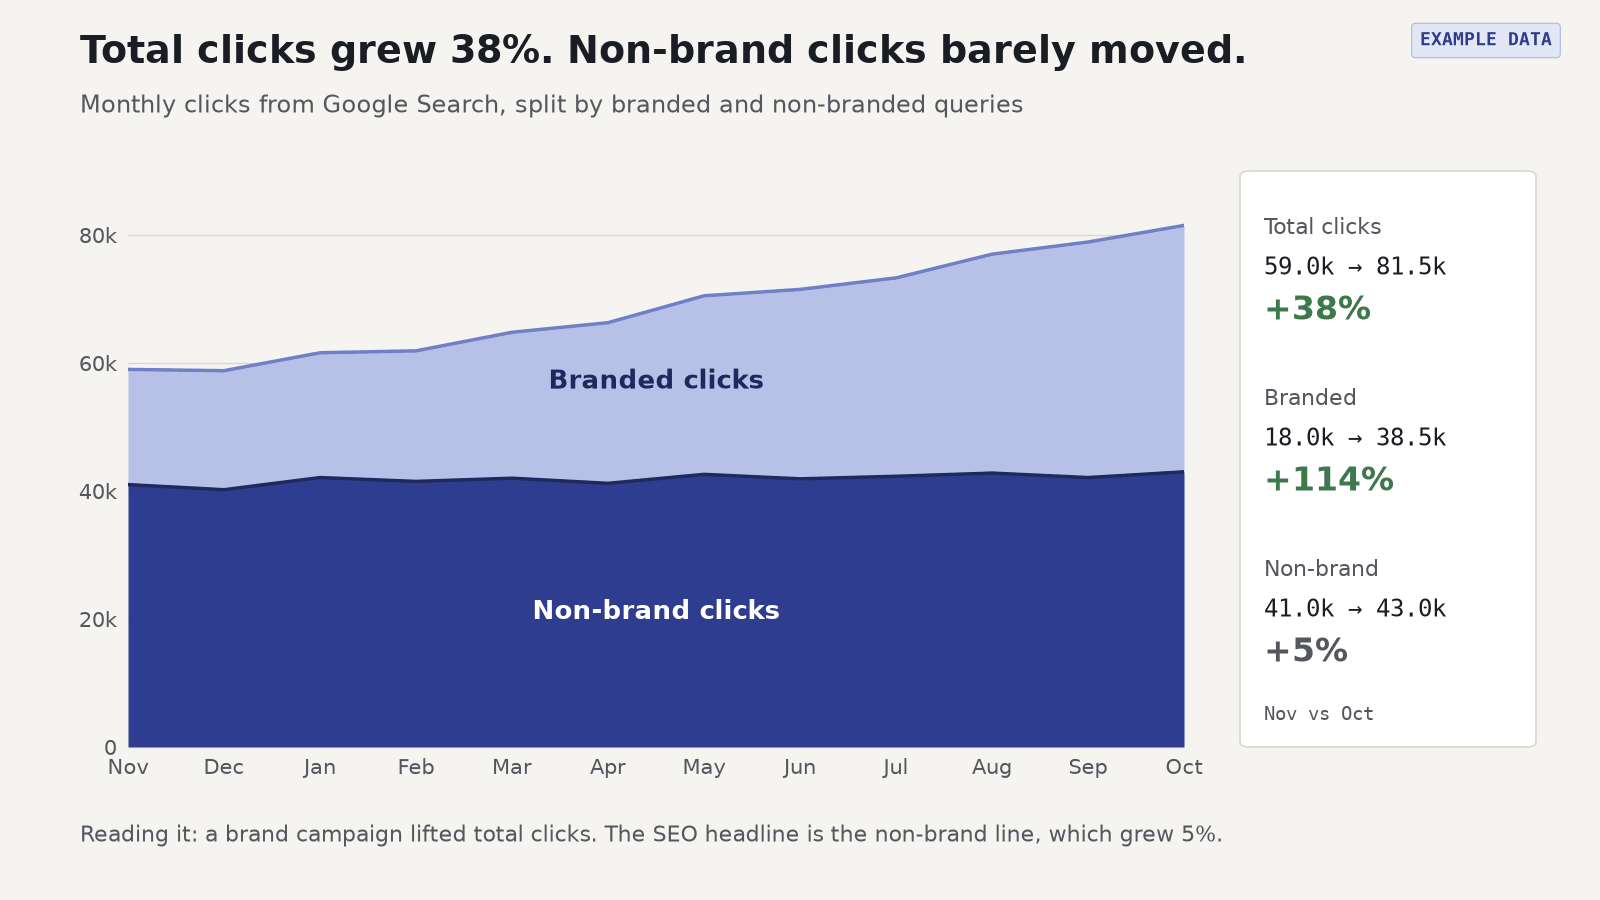
In Serplyze you set a project's brand terms once in Settings; Traffic's "Exclude branded" switch then drops them from the query lists, and the chart shows non-brand clicks as their own area.
2. Impression share of a keyword group
What it is. Your impressions for a set of target keywords, divided by the total monthly searches for those keywords.
How to measure it. Export impressions for the group from Search Console (filter Query with a regex for the topic). Take search volumes for the same keywords from a keyword research tool, then divide.
Why it matters. Clicks show how well you convert the demand you reach. Impression share shows how much of it you reach at all. A low share on a priority topic is a content gap, not a CTR problem.
Common trap. Search volumes are rounded yearly estimates. Use this KPI to compare topics and track direction, not as a precise figure.
3. Weighted position for tracked keywords
What it is. The average ranking of the keywords you track, weighted by each keyword's impressions.
How to measure it. Search Console reports position as the topmost position of your site, averaged across queries. For your tracked list, multiply each keyword's position by its impressions, sum, and divide by total impressions.
Why it matters. One number for whether rankings on the terms you chose are moving the right way.
Common trap. A plain average misleads in both directions. Add 50 new keywords at position 40 and it gets worse, though nothing dropped. Lose a weak keyword entirely and it improves. Show the distribution next to it (the next KPI), and note when the keyword list changed.
4. Top-3 and top-10 keyword counts
What it is. How many tracked keywords rank in positions 1-3, and how many in 1-10.
How to measure it. Count the keywords whose average position for the month is 3.0 or better, and 10.0 or better. Use the same keyword list every month.
Why it matters. Most clicks go to the top few results, so moving from 8 to 3 matters far more than 38 to 31. Counts are also easy for non-SEOs to read.
Common trap. Search Console positions are averages across locations and devices. A keyword at 3.4 may be at 1 on mobile in one country and 9 elsewhere. Use the counts for the trend, not to argue about one keyword's exact rank.
5. CTR vs expected CTR by position
What it is. The gap between a query's actual click-through rate and the CTR that queries at the same position usually get on your site.
How to measure it. Export queries with clicks, impressions and position. Round positions to whole numbers and take the median CTR at each: that's your expected CTR curve. Flag queries well below it.
Why it matters. A page that ranks well but doesn't get clicks is often fixable with a better title or snippet. These are some of the cheapest clicks you can win.
Common trap. Generic CTR curves from industry studies don't fit your site, because brand queries, SERP features and AI Overviews all change CTR. Build the curve from your own non-brand queries, and expect some gaps to come from the results page, not your snippet.
6. Pages with clicks
What it is. The number of URLs that got at least one click from Google Search in the period.
How to measure it. In Search Console, open the Pages tab of the Performance report and count the rows with clicks above zero. The interface exports at most 1,000 rows, so larger sites need the API or the BigQuery bulk export.
Why it matters. It shows how much of the site earns search traffic. If you published 80 articles and this barely moved, the new pages aren't working.
Common trap. Splitting one strong page into five weak ones raises this number and often lowers total clicks. Read it next to KPI 1.
7. Content decay count
What it is. The number of pages whose clicks have fallen well below their own peak, for example 30% or more over the last three months.
How to measure it. Export clicks per page per month for 16 months, the most Search Console keeps. Compare each page's recent months with its best month, in clicks per day so short months don't look like drops.
Why it matters. Older pages lose rankings slowly, which is easy to miss when new content keeps the site total up. The count turns refresh work into a number you can plan around.
Common trap. Seasonal pages look like decay every off-season. Compare against the same months last year before you add a page to the refresh list.
Serplyze's content decay heatmap does this calculation for your top pages and labels each one decaying, growing or stable.
8. Organic key events and revenue (GA4)
What it is. Leads, sign-ups, purchases and revenue from sessions whose channel is Organic Search.
How to measure it. In GA4, open the traffic acquisition report, filter Session default channel group to Organic Search and read the key events and revenue columns. Pick the events that matter and mark them as key events first. Key events are what GA4 used to call conversions.
Why it matters. This is the number the business cares about; the other nine are leading indicators of it.
Common trap. GA4 doesn't know which query brought the session, and consent banners and ad blockers mean it sees fewer visits than Search Console. Don't add sessions and clicks together or expect them to match. Report them side by side, and treat any revenue-per-keyword figure as an estimate.
9. AI Overview exposure
What it is. How much of your search visibility comes from queries likely to show an AI Overview, and whether those queries are losing clicks while rankings hold.
How to measure it. Search Console includes AI Overviews and AI Mode in the Web search type and doesn't separate them. So estimate: filter with a regex for long, question-style queries (how, what, why, five or more words) and track their share of impressions and their CTR at stable positions.
Why it matters. It answers "we still rank first, so why are clicks down?" with something you can back up. More in zero-click searches.
Common trap. It's an estimate, so label it as one. Search Console doesn't report which impressions came from an AI feature, so "AI Overviews cost us X clicks" is never a measured fact.
Serplyze's AI search page tracks these queries over 16 months and keeps measured numbers apart from estimates.
10. Share of voice in a keyword group
What it is. The share of the clicks available in a keyword group that you're likely to get, given where you rank.
How to measure it. From Search Console alone, use a proxy: for each keyword, multiply impressions by the expected CTR at your position (KPI 5), then divide the sum by what you'd get at position 1. Comparing against named competitors needs third-party rank data.
Why it matters. It reports a topic, such as "running shoes," as one number combining rankings and demand, which reads better in a quarterly review than 200 keyword positions.
Common trap. The answer depends on the keyword list. Fix the list for the year, group it by topic (see keyword clustering), and note any changes.
Vanity metrics to drop
Some numbers look good on a slide but don't help anyone decide what to do next.
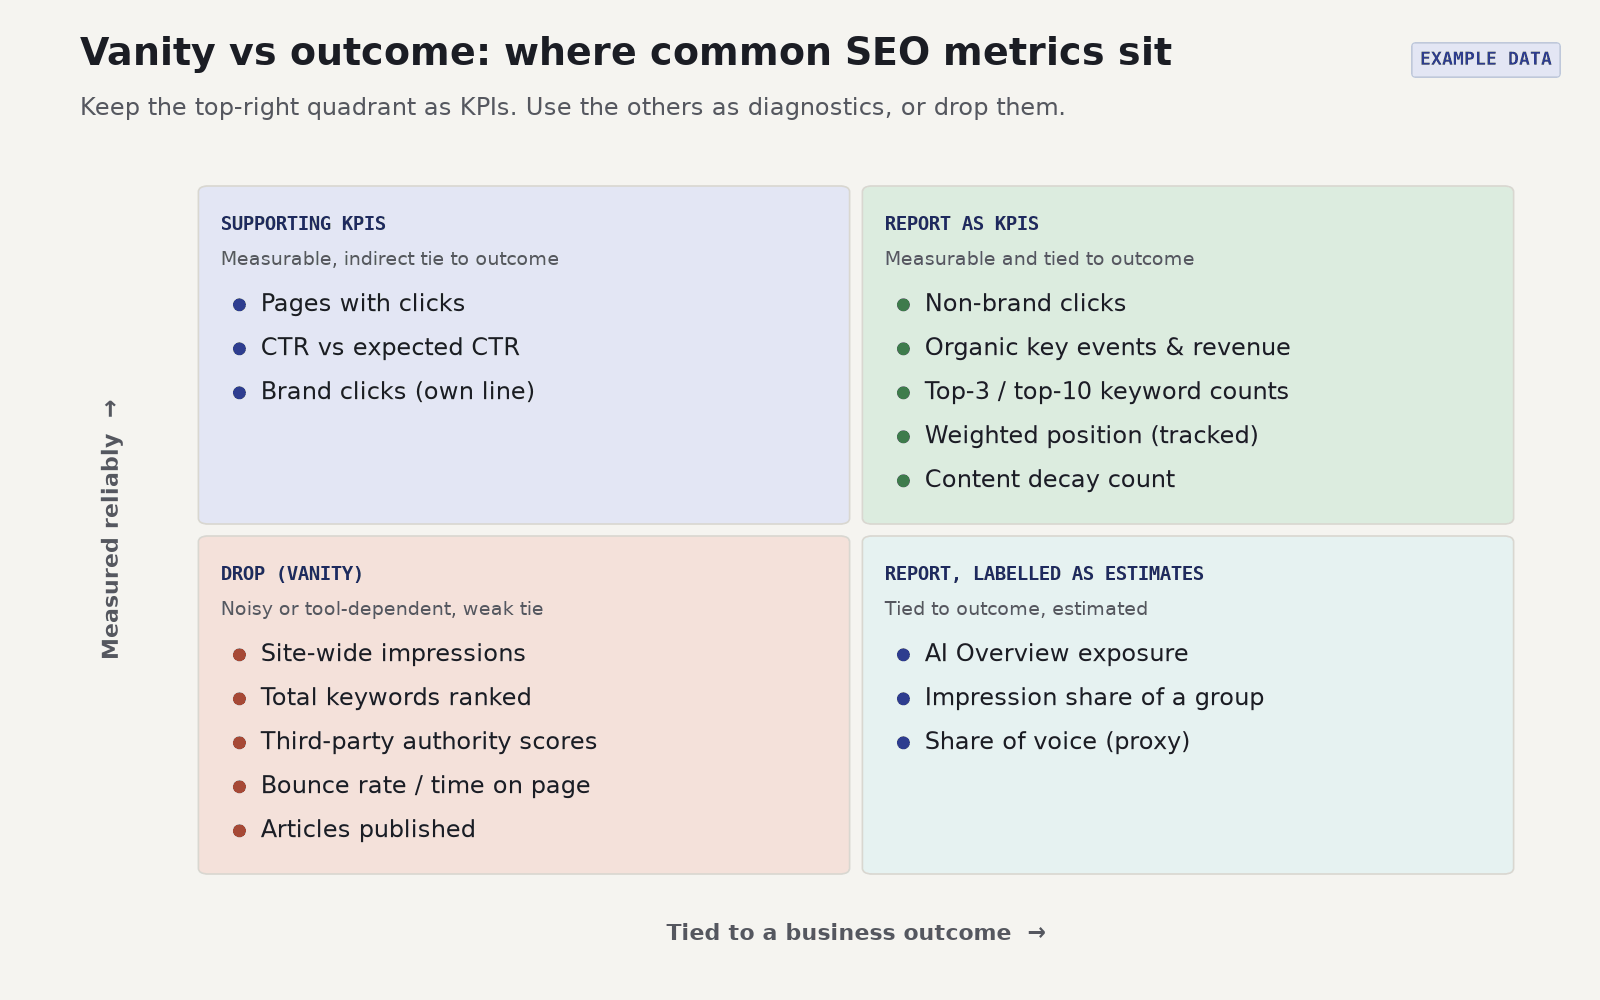
- Total keywords ranked. Mostly page-5 queries nobody clicks. Use top-3 and top-10 counts.
- Site-wide impressions. One branded news spike can double it. Use a keyword group's impressions.
- Third-party authority scores. A vendor's model of links, not Google's. Fine for link prospecting, not as a KPI.
- Bounce rate and time on page. In GA4, bounce rate is simply the inverse of engagement rate, and neither one tells you whether search did its job. Report key events instead.
- Number of articles published. That's an output, not an outcome. Report pages with clicks.
- All clicks, brand included, as the headline. Show brand clicks, but on their own line.
How to set targets
Targets should come from your own history, not from a benchmark found online.
- Pull 16 months of data. That's everything Search Console keeps: a full year of seasonality plus the latest quarter.
- Set the baseline. For each KPI, look at the same period last year and the last three months' trend.
- Estimate the work. List planned refreshes, new pages and CTR fixes, and estimate each one's effect with your own CTR curve (say, a keyword with 10,000 monthly impressions moving from 6 to 3).
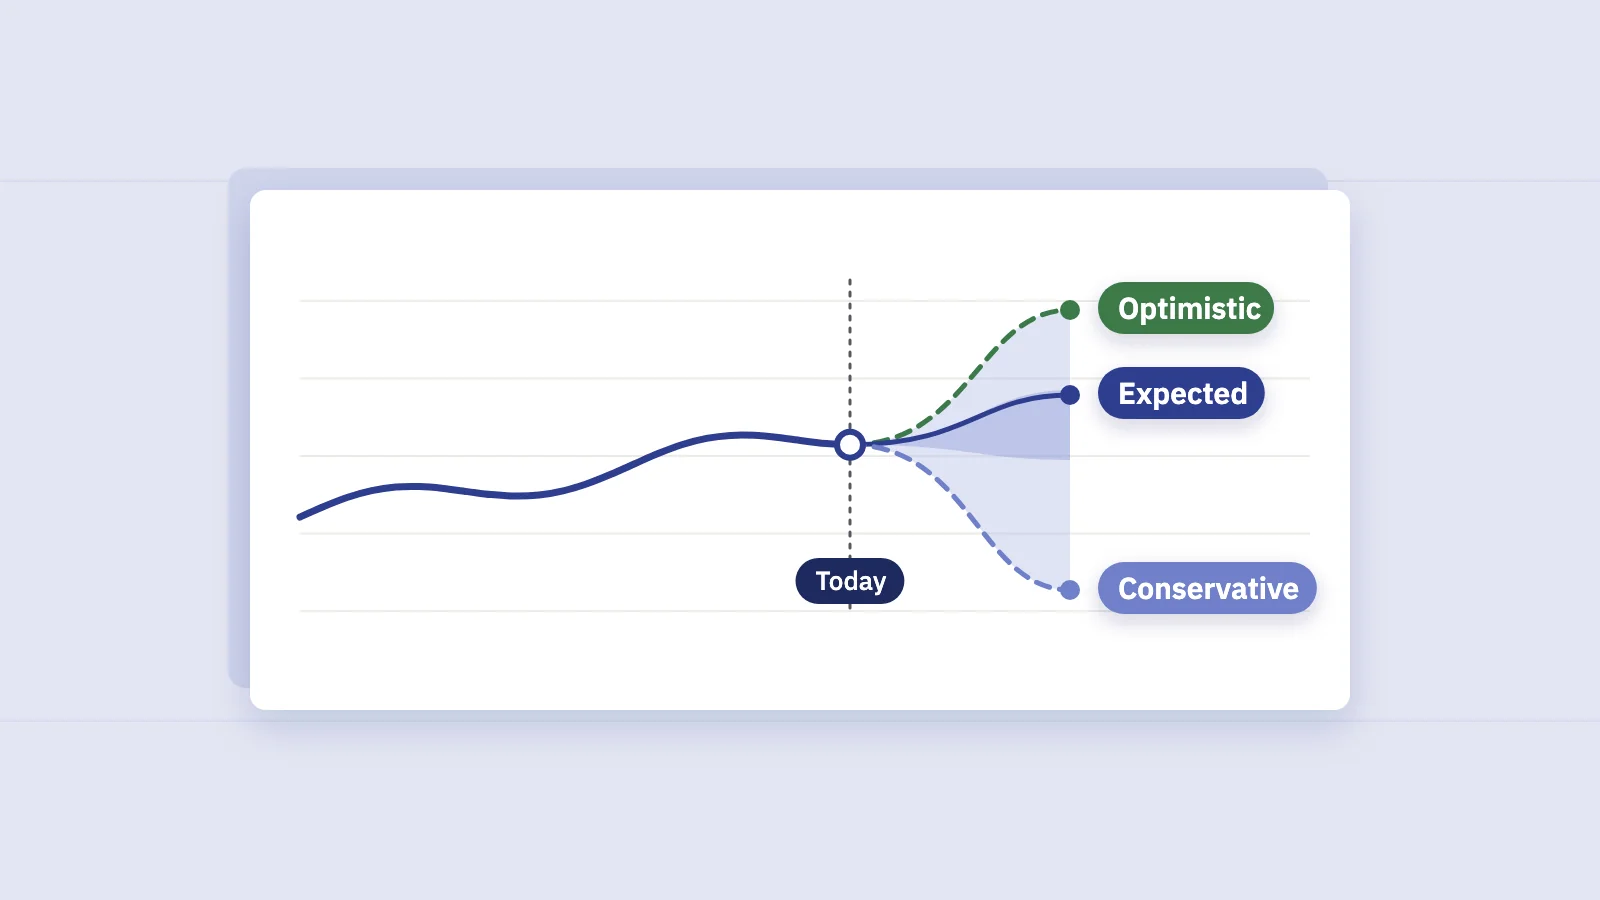
- Give a range. A conservative and an expected case are more honest than one figure, and easier to defend.
- Agree on which KPIs count. Pick three or four as the headline targets, usually non-brand clicks, organic key events and one of the ranking KPIs. Report the rest as diagnostics.
When you set a target, write down what is outside SEO's control, such as a migration or a brand campaign. It saves an argument at review time.
How often to report
Search data is noisy day to day, so match the frequency to how fast each KPI moves:
- Weekly, internal only: alerts for drops in non-brand clicks or top-10 keywords.
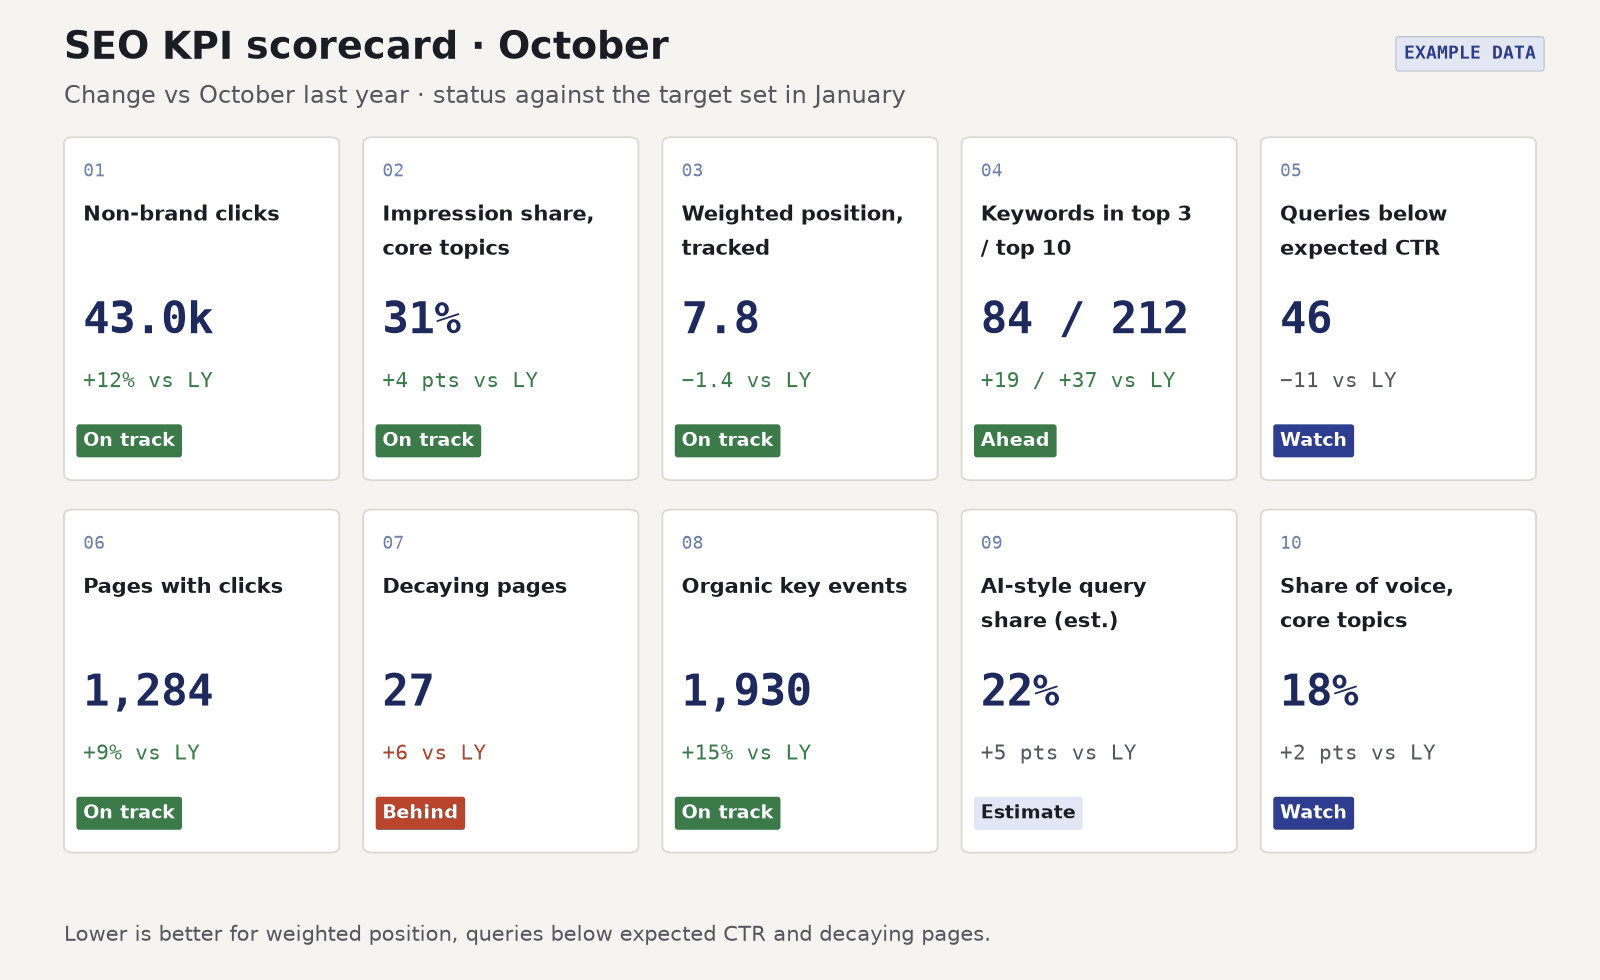
- Monthly: KPIs 1, 3, 4, 5, 6 and 8, compared with the previous month and the same month last year.
- Quarterly: KPIs 2, 7, 9 and 10, together with how you're tracking against your targets.
A monthly report should fit on one page plus a short "what changed and what we're doing" note. Our SEO report template walks through the layout.
Search Console's most recent days are preliminary and can still change. End a monthly report on a date a few days in the past so the numbers don't shift after you send it.
Key takeaways
- Split branded from non-branded traffic everywhere. Non-brand clicks are the headline SEO KPI.
- A plain average position misleads. Weight it by impressions and show top-3 and top-10 counts next to it.
- Report organic key events and revenue from GA4 next to Search Console. Don't merge the two.
- Label AI Overview figures as estimates. Search Console doesn't separate them.
- Drop total keywords ranked, site-wide impressions and authority scores.
- Set targets from 16 months of your own data, as a range.
Serplyze builds most of these KPIs from your own Search Console data every day, including non-brand clicks, rank distribution, content decay and AI search exposure. Start free and connect a Search Console property.