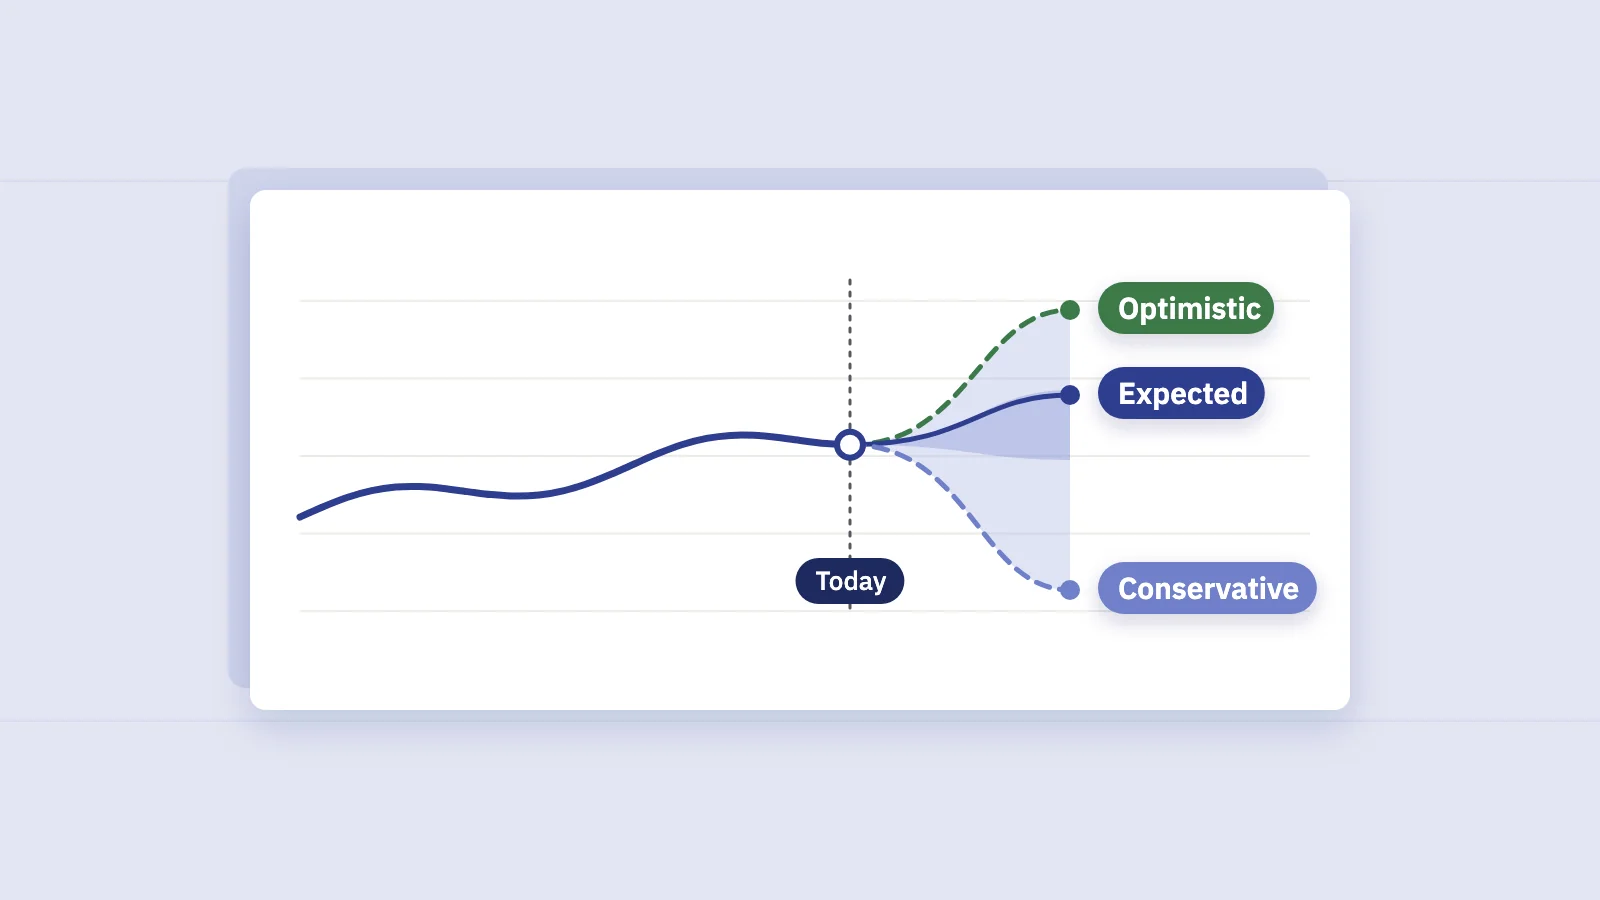
An SEO forecast is a range of likely organic clicks for the coming months, built from your own history plus the ranking changes you plan for. Search Console gives you enough data to build one in a spreadsheet, as long as you respect its limits.
What an SEO forecast is (and isn't)
A useful organic traffic forecast answers two separate questions:
- Where are we heading if we keep doing what we do? That's the baseline: your trend and your seasonality carried forward.
- What would it be worth if rankings moved? That's a scenario: a ranking change you choose, turned into clicks with a click-through rate (CTR) curve.
Keep the two apart. The baseline is something you can measure from the data. The scenario is an assumption you type in. When they're blended into one number, nobody can tell which part was the data and which part was the hope.
A forecast isn't a promise. Search demand shifts, Google ships updates, and competitors publish. That's why the third method below matters as much as the first two: show a range, not a single number.
Method 1: baseline trend with seasonality
Search Console keeps 16 months of performance data. That's enough to fit a trend and to see each calendar month at least once, which is what a seasonal baseline needs.
Daily clicks are the product of a few patterns stacked on top of each other:
- Trend. The slow direction of travel over the whole period.
- Yearly pattern. Busy and quiet months: a retailer's November, a tax site's spring, a B2B site's August.
- Weekday pattern. Many B2B sites drop at weekends; many consumer sites peak on them.
- Leftover noise. Everything the patterns don't explain: updates, outages, a viral post.
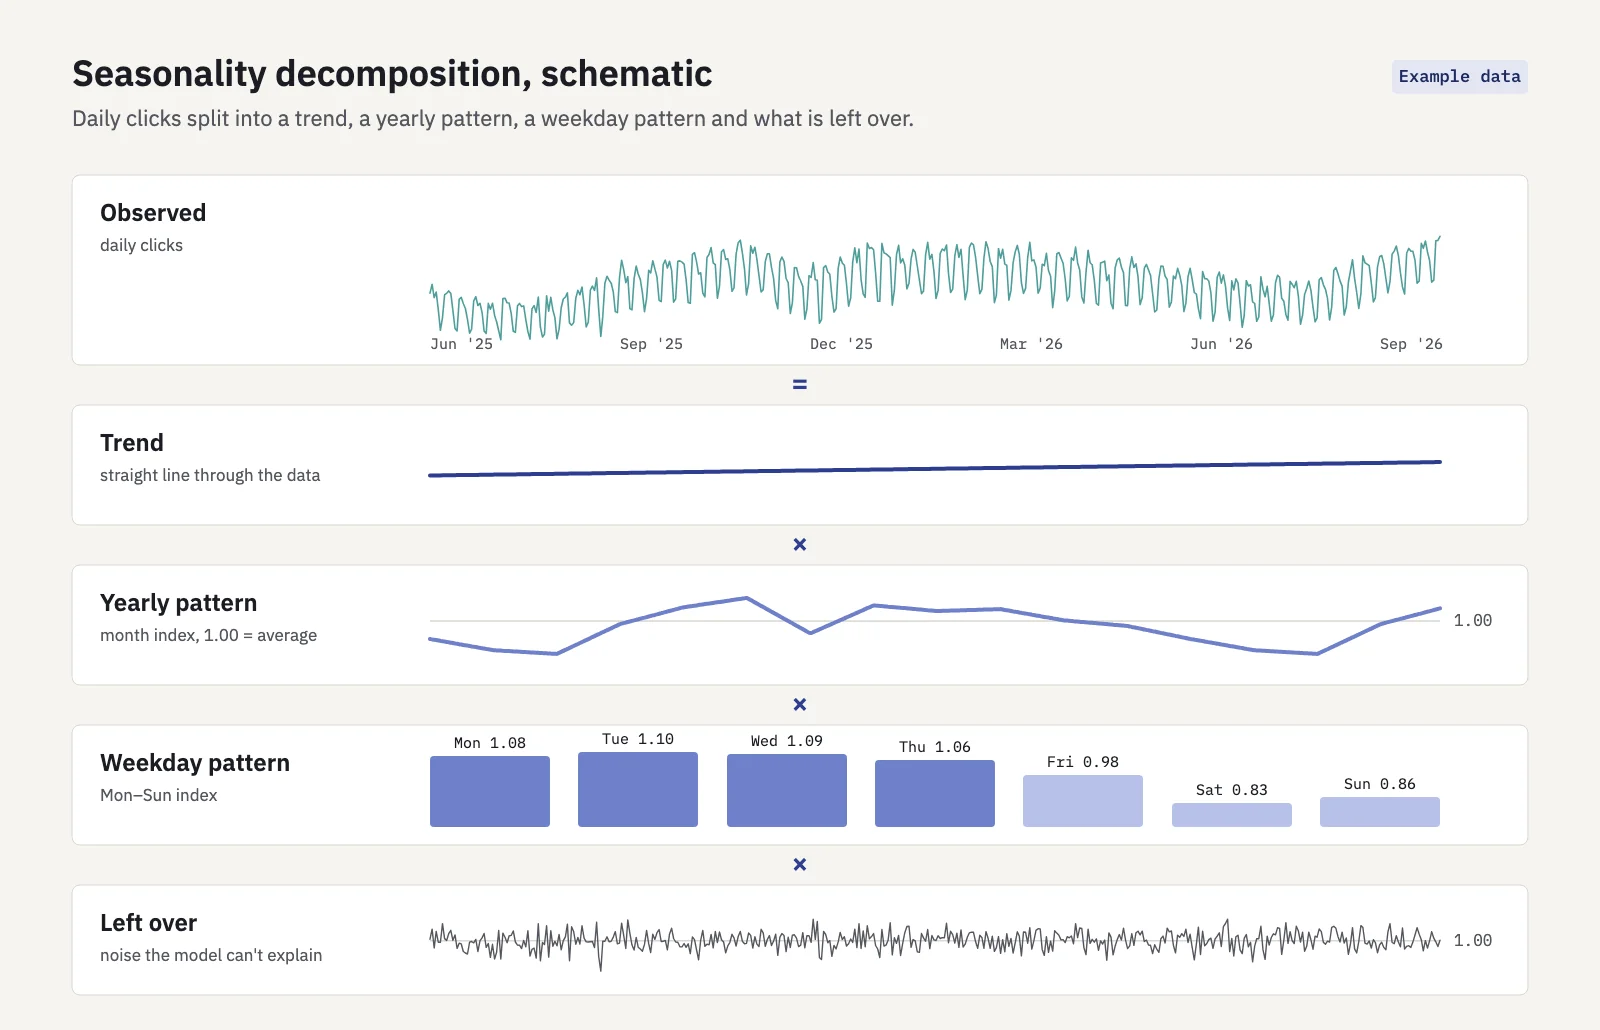
To forecast, you carry the trend forward, multiply by the pattern for each future month, and use the size of the leftover noise to set the width of your range. Forecasting by month is simpler, and the weekday pattern then averages out. You only need it when forecasting by day or week.
Method 2: position-gain scenarios
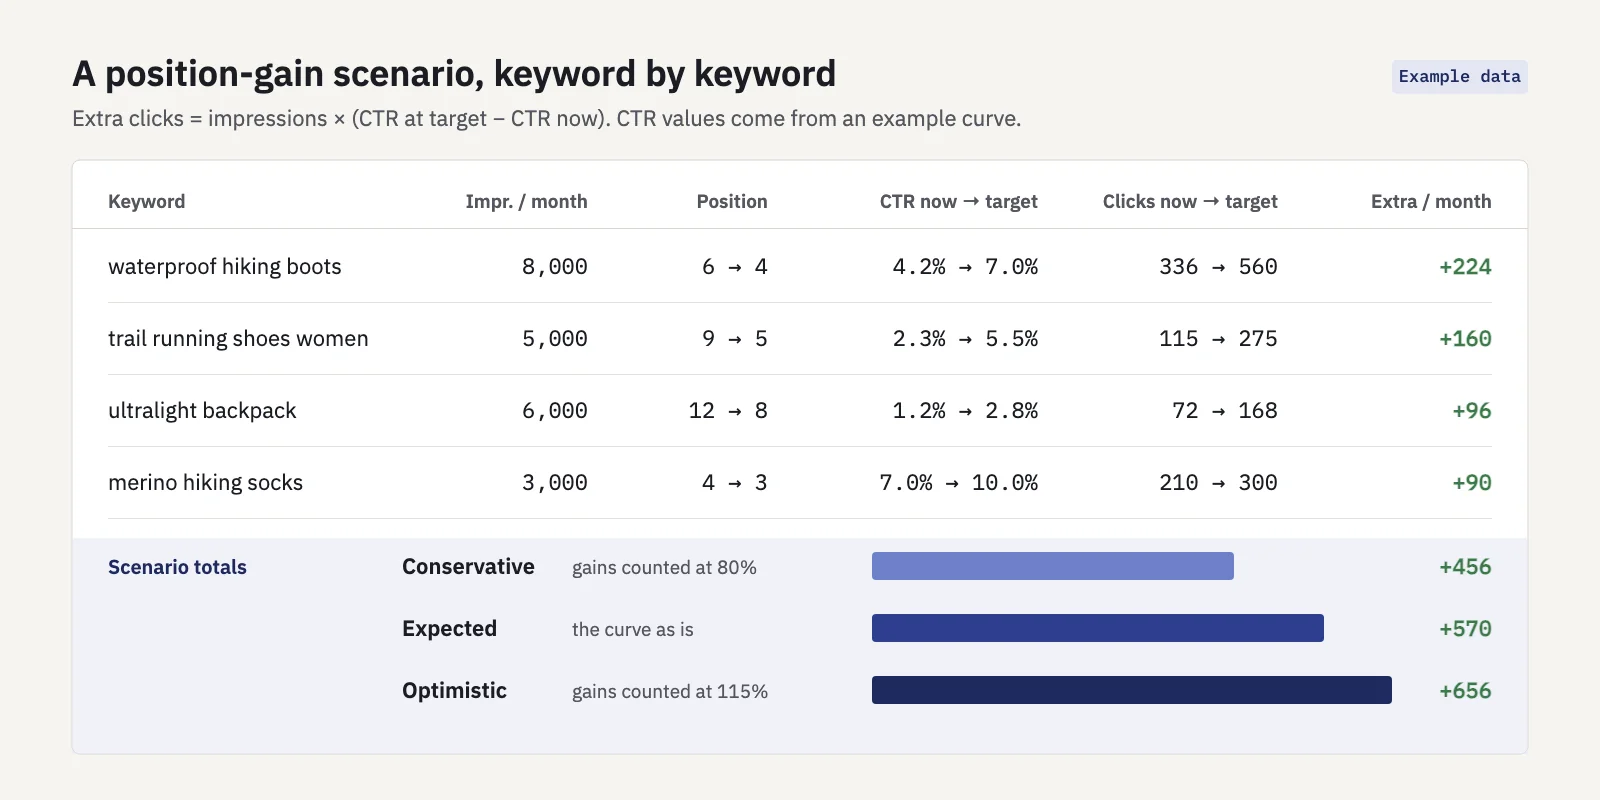
The baseline tells you nothing about what a content push or a technical fix could add. For that, model rankings directly, keyword by keyword:
Extra clicks = monthly impressions × (CTR at target position − CTR at current position)
Search Console has no search volume, but impressions at your current position are a fair stand-in for the demand you can reach. The CTR curve maps each position to an expected click-through rate. Build it from your own non-brand queries if you have enough data, because published industry curves average over other sites and other kinds of query.
Three rules keep scenarios honest:
- Move keywords that can realistically move. Pages ranking 4 to 15 are the usual candidates. A page at position 40 needs more than a forecast.
- Spread the gain over time. Rankings rarely jump the day you publish. Ramp the change in over a few months.
- Count the downside. Keywords already in the top 3 have little room to gain and real room to slip. Add a risk line that shows what a one-position drop would cost.
Method 3: ranges, not single numbers
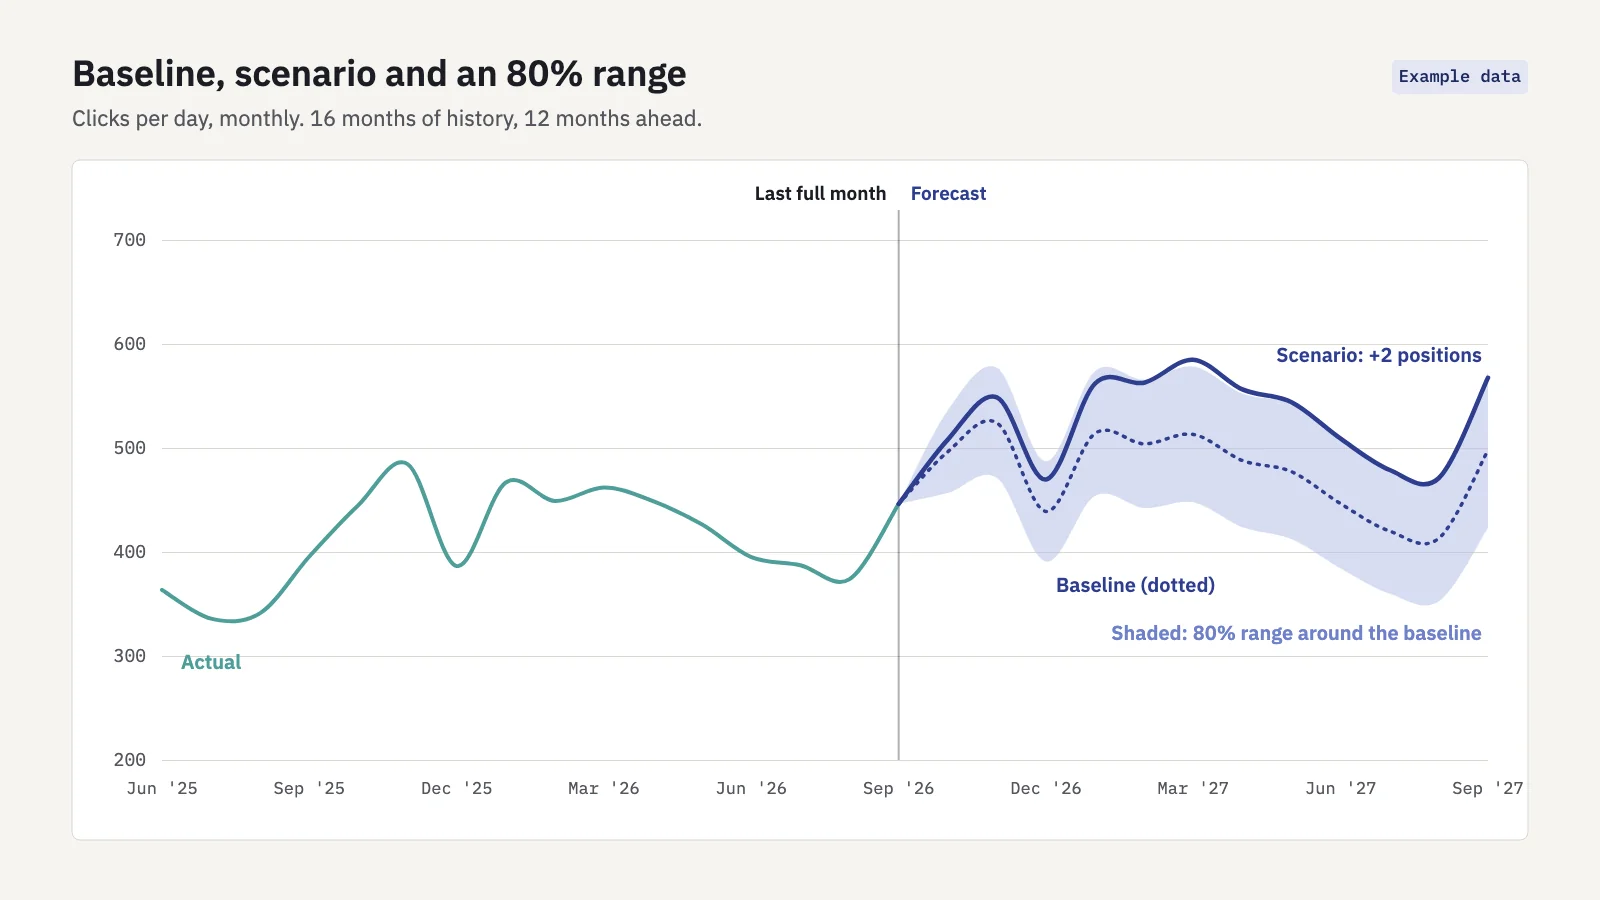
Every forecast has two sources of error: the baseline's normal ups and downs, and the uncertainty in the scenario itself. Show both.
- For the baseline, measure how far actual months strayed from your fitted line, and turn that into a band. An 80% range (roughly ±1.28 times the typical error) is easier to defend than 95%, which tends to be uselessly wide on 16 months of data.
- Widen the band with distance. Next month is easier to call than month twelve.
- For the scenario, run it with more than one CTR assumption: a conservative curve, an expected one and an optimistic one.
A spreadsheet method, step by step
Forecasting SEO traffic doesn't need special software. This is a monthly forecast you can build in Google Sheets or Excel in under an hour. The numbers in the worked example are Example data, not a real site.
- Export 16 months of daily clicks. In Search Console, open Performance > Search results, set the date range to the last 16 months and open the Dates tab under the chart. Export it. About 486 days fits well within the 1,000-row export limit. If you can, filter out branded queries first (see the mistakes below).
- Roll up to whole months. Sum clicks per calendar month, then divide by the number of days to get clicks per day. Drop the current, partial month, and remember the last few days in Search Console can still be preliminary.
- Fit the trend. Number the months 1 to 16 and use
=TREND()(or=FORECAST.LINEAR()) on clicks per day. In the example, the trend starts near 390 clicks a day and rises about 3 a month. - Calculate a seasonal index. For each month, divide actual clicks per day by the trend value. Where a calendar month appears twice (16 months covers four months twice), average the two ratios. In the example, November's index is 1.20 and August's is 0.86.
- Project forward. For each future month, extend the trend and multiply by that month's index, then by the days in the month. In the example, October comes out at about 486 clicks a day, or roughly 15,100 for the month.
- Backtest to size the range. Fit steps 3 to 5 on the first 13 months only, forecast the last three, and compare with what happened. In the example, the backtest came out 5% to 10% too high, so a ±10% range for the next month is the minimum honest band. Widen it for months further out.
- Add the scenario on top. List the keywords you plan to work on with their monthly impressions and positions, apply the extra-clicks formula from method 2, ramp the gain in over the months you expect it to take, and add it to the baseline.
| Example data | Clicks per day | Trend | Seasonal index (averaged) |
|---|---|---|---|
| Nov 2025 | 485 | 405 | 1.20 |
| Aug 2026 | 374 | 433 | 0.86 |
| Sep 2026 | 446 | 436 | 1.01 |
| Oct 2026 (forecast) | 486 | 439 | 1.11 |
With 16 months, every seasonal index rests on one or two observations. A single odd month (an outage, a core update) goes straight into the index for that month. Look at the ratios before you trust them, and replace an obviously broken month with its neighbors' average.
How Serplyze builds the same forecast
If you'd rather not maintain the spreadsheet, an SEO forecasting tool can do it for you. Serplyze's Forecast screen runs these steps on your synced Search Console data. It fits a straight trend, a weekday pattern and, when you learn from a 12- or 16-month window, a yearly pattern from your site's daily clicks. Going forward, the trend flattens so a short window doesn't run away, and the baseline gets an 80% range from how far clicks strayed from the fit. For the scenario, you choose a scope (all keywords, non-brand only or a keyword group), how many positions keywords ranked 4 to 15 move up, over how many months, and a conservative, expected or optimistic CTR assumption. There's an optional risk line where top-3 keywords slip one rank. The Forecast docs spell out the method and its limits, including that it has no search volume or competitor data.
How to present a forecast to stakeholders
A forecast is only useful if people read it the way you meant it. A few habits help:
- Lead with three numbers. Low, expected and high for the period that matters to them (a quarter or the year). Say what the range means: "8 times out of 10, we expect to land between these."
- Separate baseline and uplift. For example: "We expect about 420,000 clicks without changes, and 40,000 to 60,000 more if the category pages reach the top 5." The uplift is what you're asking budget for, so show it on its own line.
- List the assumptions. Which keywords, which positions, by when, which CTR curve. Anyone can then challenge an assumption instead of the whole forecast.
- Set checkpoints. Agree on monthly or quarterly dates to compare actuals with the forecast. Report the gap and the reason, then re-forecast. A forecast that's never checked teaches nobody anything.
- Use the same language as your reports. If your monthly report already tracks non-brand clicks and top-10 counts, forecast those, so the report and the forecast line up.
Common SEO forecasting mistakes
Ignoring the 16-month limit
Sixteen months is one full year plus four months. You see each season once, maybe twice, so one unusual November becomes "the November pattern". If you need longer history, start saving it now: export regularly, or set up Search Console's bulk data export to BigQuery, which writes a daily copy into your own project, so your history keeps growing past 16 months. Don't stitch in data from a different property or a pre-migration domain without marking it.
Treating seasonality as a trend
A rise from August to November is often just the calendar. Compare a month with the same month last year, not with the previous month, before you call anything growth. Watch moving dates too: Easter, Black Friday and school holidays shift between years.
Mixing brand and non-brand
Branded searches follow your marketing, PR and product launches, not your SEO work. A TV campaign can lift branded clicks and make the SEO forecast look brilliant. Forecast non-brand separately, using Search Console's branded queries filter where it's available or a regex on your brand terms.
Using a CTR curve from before AI Overviews
Generic CTR curves assume a page of ten blue links. On queries with an AI Overview, the top results get far fewer clicks: Ahrefs found that an AI Overview correlated with a 58% lower average CTR for the top-ranking page, comparing 300,000 keywords in December 2023 and December 2025. If your informational queries show these features, use your own recent CTR by position, or count gains at a discount. Our guide to zero-click searches shows how to spot the queries that lose clicks.
Trusting average position too much
Average position in Search Console is an average across every impression, and it moves when you rank for new queries. A keyword at "6.4" may be 3 on mobile and 11 on desktop. Scenario math works best per query, on average positions that have been stable for a few weeks.
Key takeaways
- Build an SEO forecast in two layers: a baseline from trend and seasonality, and a scenario from position gains.
- Search Console's 16 months are enough for one seasonal cycle; backtest on the last few months before you trust the pattern.
- Scenario uplift = impressions × (CTR at target − CTR now), ramped in over months, with a risk line for top-3 keywords.
- Always present a range (low, expected, high) with the assumptions listed and checkpoints agreed.
- Forecast non-brand separately and discount CTR on queries where AI Overviews take the clicks.
Serplyze fits a seasonal baseline to your own Search Console history and lets you test ranking scenarios with an 80% range, for all your tracked keywords, non-brand only or one keyword group. Start free and see what your next 12 months look like.