A visibility score tells you what share of the available clicks your rankings should be earning across a set of keywords. Here is what goes into one, why every tool reports a different number, and how to calculate your own from Search Console.
What a visibility score is
An SEO visibility score is a click-weighted share of the possible traffic for a keyword set. For every keyword you take the click-through rate you would expect at your current position, multiply it by the demand for that keyword, and compare the total with what you would get if you ranked first for all of them.
Written out:
Visibility = Σ (demand × expected CTR at your position) ÷ Σ (demand × expected CTR at position 1)
Three things go into it:
- A keyword set. The queries you care about. The score only describes this set, never "your SEO" in general.
- A CTR-by-position curve. How often a result at position 1, 2, 3 and so on gets clicked. This is what turns positions into expected clicks.
- A demand weight. Search volume in third-party tools; impressions when you build it from Search Console.
Ranking first for everything gives 100%. Moving from position 9 to 4 on a big keyword lifts the score far more than moving from 30 to 12 on a small one, because the curve is steep at the top and almost flat below page one. That is the point of the metric: it rewards the ranking changes that move traffic.
People search for this under several names: visibility score, SEO visibility, keyword visibility, Google visibility score. They all describe the same idea with different inputs.
Why tools give different visibility scores
Run the same domain through three SEO tools and you get three different numbers. None of them is wrong; they measure different things.
| Input | What varies between tools |
|---|---|
| Keyword set | A tool's own database of keywords for a whole country, or the keywords you chose to track |
| Demand weight | Estimated monthly search volume, or your own impressions |
| CTR curve | Each tool's own estimate of clicks by position, rarely published in full |
| Positions | Scraped from one location and device on one day, or averaged from real searches |
| Scale | A share from 0 to 100%, or an open-ended index |
Two common designs show the range. Some tools build an open-ended index from rankings for their own large keyword set, weighting each by search volume and the expected click rate at that position. Others report a share from 0 to 100% based on the CTR of your positions for the keywords you track, reading 100% when you rank first for all of them.
So compare a score only with itself: same tool, same keyword set, same settings, over time. A 31% in one tool and 12 in another say nothing about each other.
How to calculate a visibility score from Search Console
Search Console has no search volume, but it has something better for your own site: impressions from real searches, with the average position those searchers saw. Use impressions as the demand weight and your own clicks to build the CTR curve.
Build your own CTR curve
A generic curve from an industry study won't match your site. Brand strength, rich results and the type of queries you rank for all shift it. Your own data gives a curve that fits.
- Open the data. In Search Console, go to Performance > Search results, select Clicks, Impressions, CTR and Position, and set the date range to the last three months.
- Remove branded queries. People searching your name click you at almost any position, which inflates the top of the curve. Use the branded queries filter if your property has it, or add a Query filter set to "Doesn't match regex" with your brand names, such as
yourbrand|your brand. - Export the Queries tab. The UI export stops at 1,000 rows; for a bigger site, use the Search Console API or the Looker Studio connector.
- Bucket by position. Round each query's average position to a whole number, and put everything below 10 into wider bands (11–20, 21+).
- Divide clicks by impressions per bucket. Sum clicks and impressions in each bucket first, then divide. Averaging the CTRs of individual queries gives tiny queries the same say as big ones.
- Sanity-check the shape. CTR should fall as position rises. A bump usually means one big query dominates a bucket; widen the bucket or use more months.
Here is the curve we will use below. It is example data, not a benchmark.
| Position | 1 | 2 | 3 | 4 | 5 | 6 | 7 | 8 | 9 | 10 | 11–20 | 21+ |
|---|---|---|---|---|---|---|---|---|---|---|---|---|
| Expected CTR (example) | 30% | 16% | 10% | 7% | 5% | 4% | 3% | 2.5% | 2% | 1.8% | 1% | 0.3% |
Score your keyword set
Now apply the curve to the keywords you track. For each keyword, pull its impressions and average position for the period (filter Query with "Exact query", or use the API), then add two columns:
- Earned: impressions × CTR at its current position
- Potential: impressions × CTR at position 1
Example data: an outdoor store tracking five keywords over one week.
| Keyword | Impressions | Position | CTR at position | Earned | Potential |
|---|---|---|---|---|---|
| trail running shoes | 8,000 | 3 | 10% | 800 | 2,400 |
| waterproof hiking boots | 5,000 | 1 | 30% | 1,500 | 1,500 |
| best hiking socks | 3,000 | 8 | 2.5% | 75 | 900 |
| hiking boots for women | 2,500 | 12 | 1% | 25 | 750 |
| how to lace hiking boots | 1,500 | 2 | 16% | 240 | 450 |
| Total | 20,000 | 2,640 | 6,000 |
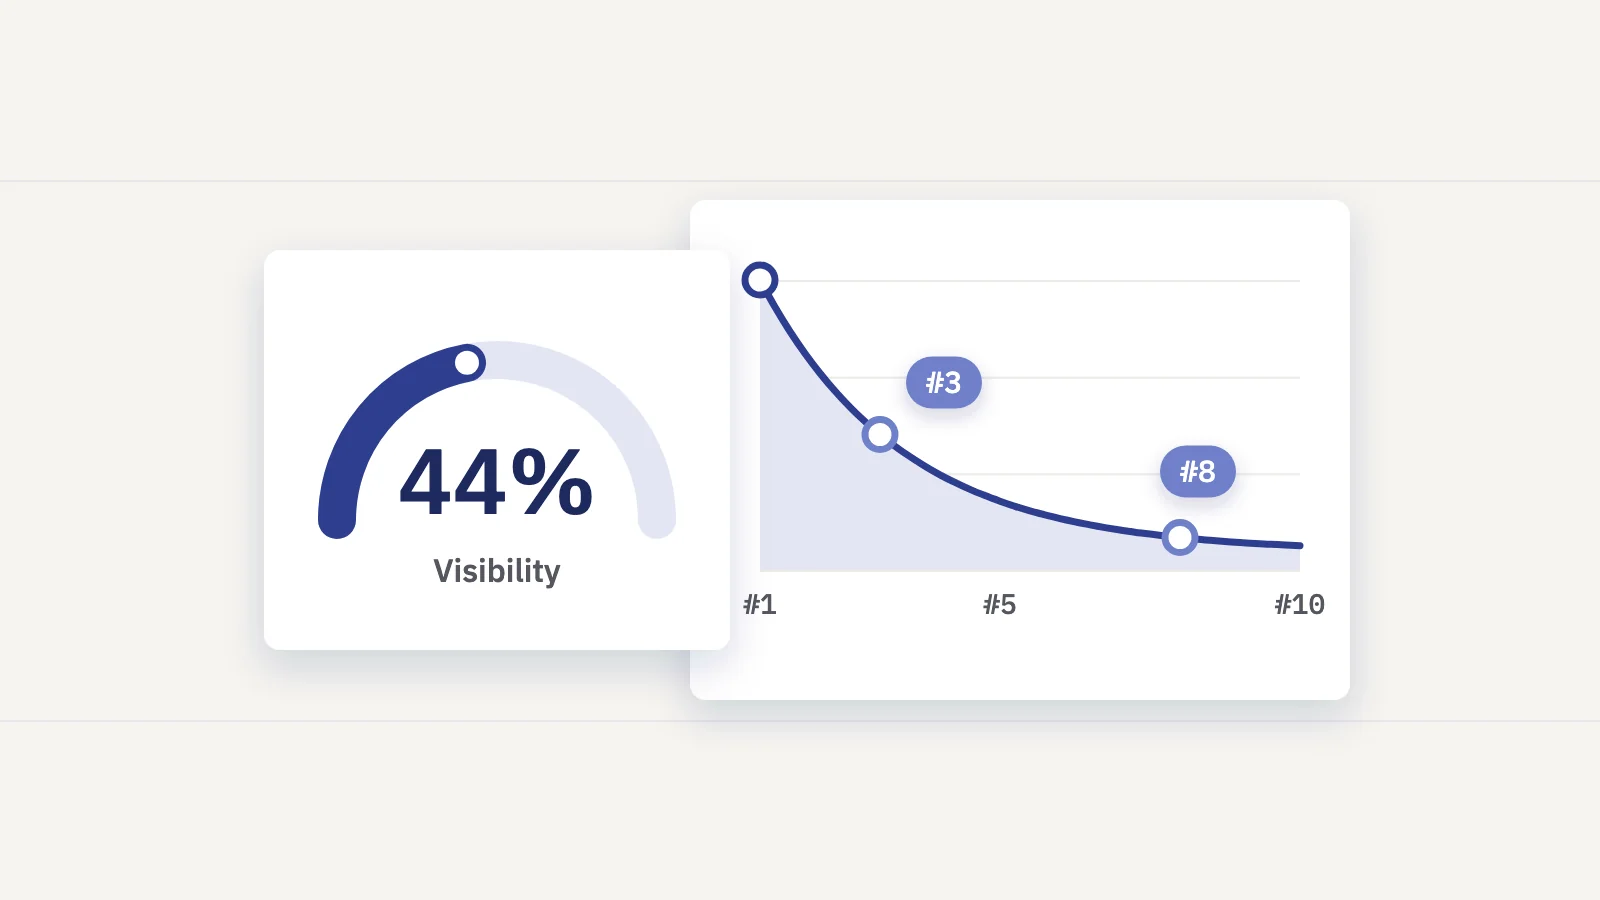
Visibility = 2,640 ÷ 6,000 = 44.0%.
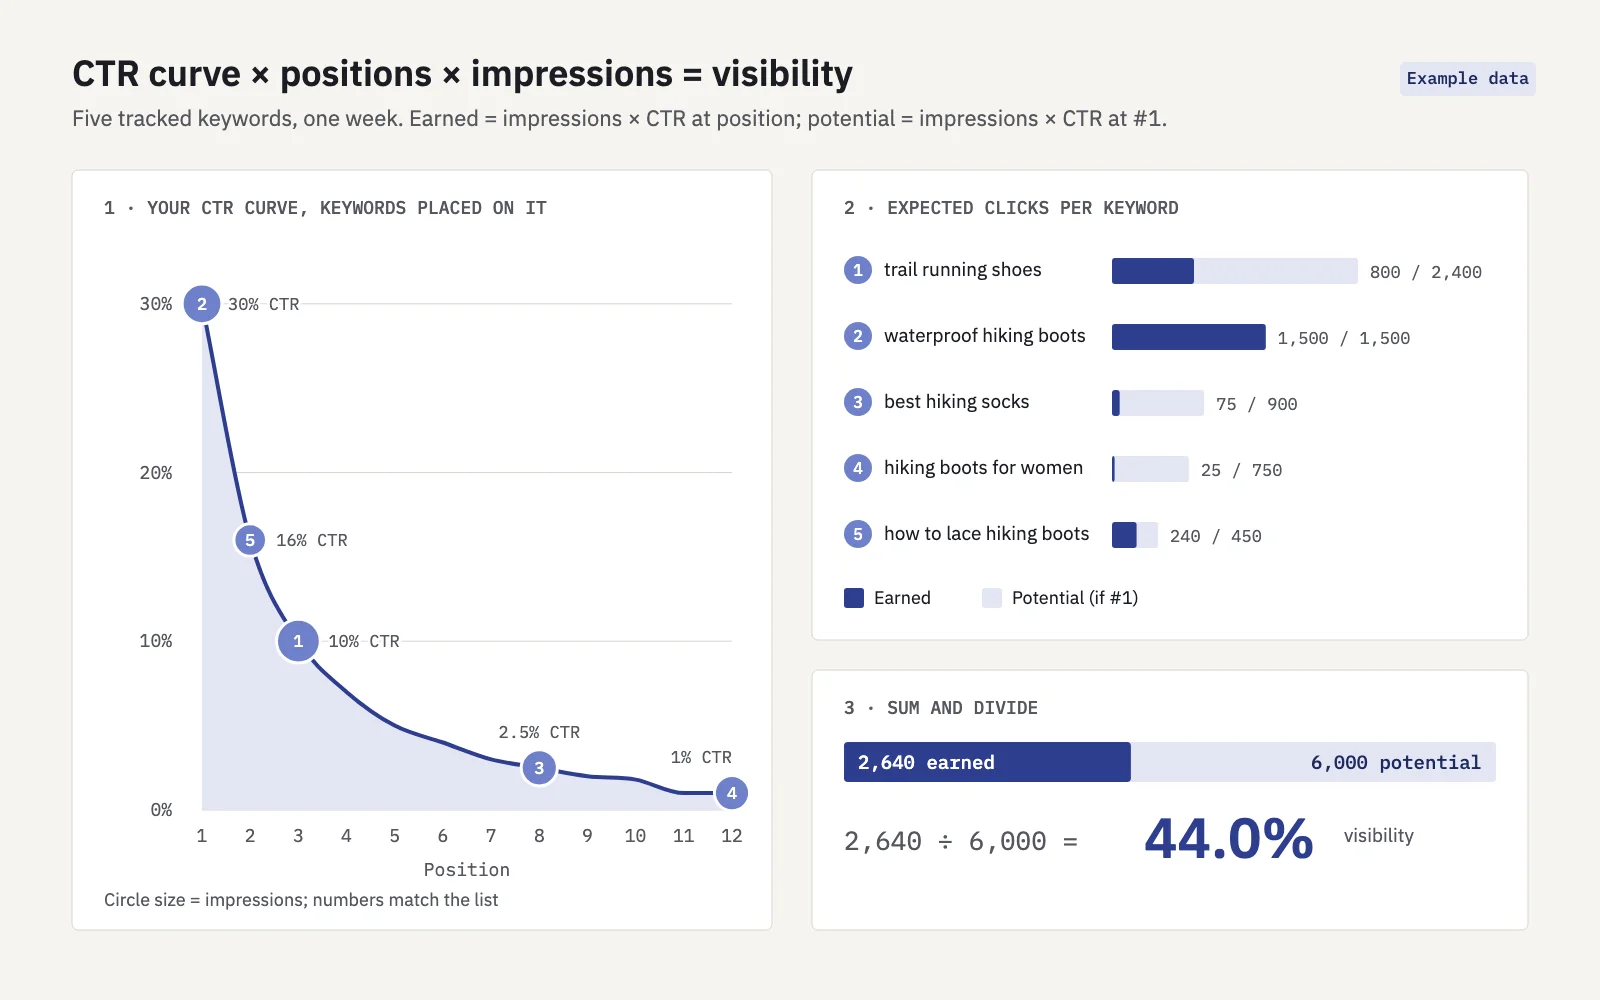 How positions, the CTR curve and impressions combine into one score. Example data.
The biggest lever is obvious from the table: "trail running shoes" leaves 1,600 expected clicks on the table at position 3. Moving it to position 1 would lift the score to 70.7%. Moving "hiking boots for women" from 12 to 5 adds 100 expected clicks, under two points. That is how visibility helps you prioritize.
A spreadsheet handles this with one lookup. Put the curve in a two-column range, round each position, and use XLOOKUP (or VLOOKUP) to fetch the CTR. If you want smoother movement, interpolate between neighbouring positions instead of rounding, so a move from 3.4 to 2.8 shows up.
Impressions only exist where Google showed your site. A keyword you don't rank for at all has no impressions, so it drops out of both sums instead of pulling the score down. Deep positions also get few impressions because few people scroll that far, so a Search Console score understates the demand you are missing. If that matters for your report, weight by search volume from a keyword tool instead and treat missing rankings as zero.
Pitfalls that make the score misleading
Using an unweighted average position instead
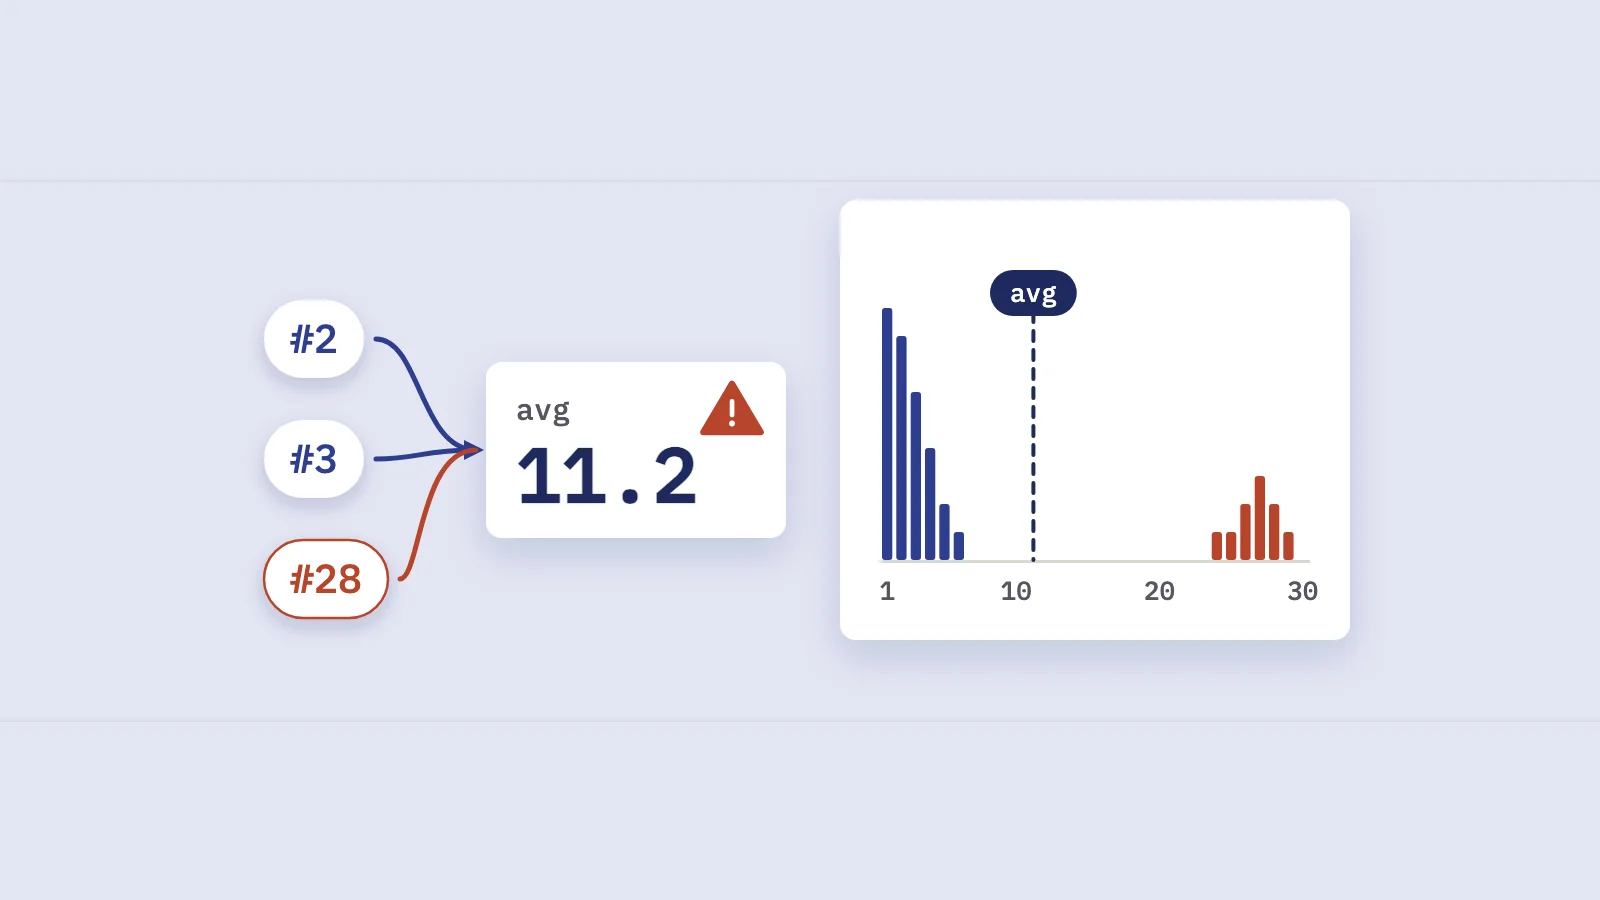
Average position looks like a simpler version of the same thing. It isn't. Take two keywords with equal impressions: one at position 1 and one at 9 averages 5, and so does a pair both at 5. On the example curve, the first pair earns 53% visibility and the second 17%. Average position treats every place as equally valuable; clicks don't. Search Console's position is also the topmost position of your site, averaged across queries, which adds its own quirks. Our guide to average position in Search Console covers them.
Changing the keyword set
The score describes the set, so changing the set changes the score even when no ranking moved. Add four new keywords you rank on page two for, and the same week drops from 44.0% to 30.1%.
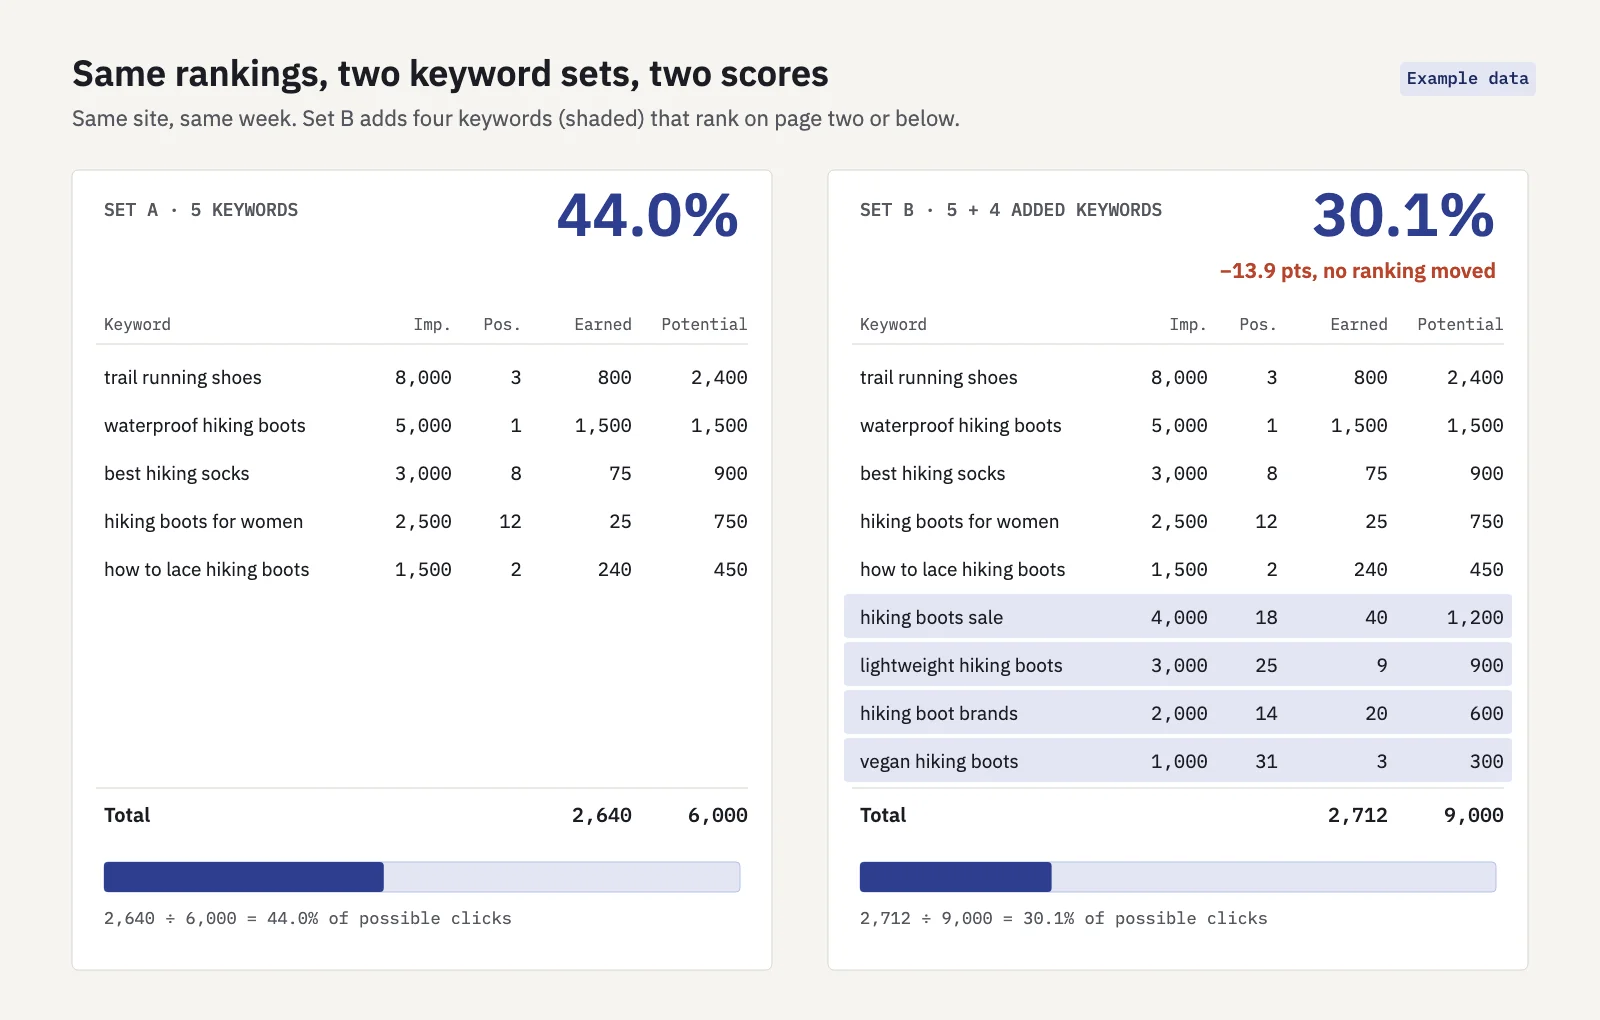 Same rankings, different keyword set, a 13.9-point drop. Example data.
Keep the set fixed for a reporting period. When you must add or remove keywords, note the date, and if you can, recalculate the previous period with the new set so the change compares like with like.
Mixing in brand terms
Branded keywords sit at position 1 with huge impressions. Include them and they dominate both sums: the score stays high and flat while your non-branded rankings slip underneath. Report brand and non-brand visibility separately, the same way you would split branded vs non-branded traffic. Search Console's branded queries filter classifies queries automatically, so spot-check what it labels as brand before you rely on it.
Ignoring device differences
Positions differ between mobile and desktop, and so does the click behaviour at each position: the screen shows fewer results on a phone and more of it goes to ads and search features. A combined score hides a drop on one device behind the other. Use the Device filter in Search Console, build a curve per device if you have the volume, and check both scores when the total moves.
Reading daily noise
A keyword's daily impressions and average position swing with weekdays and with which searches happened to fire that day. Compute the score over a rolling window, such as the last 7 days, rather than reacting to single days. Leave out the most recent days while Search Console is still filling them in.
How to report a visibility score
Visibility works best as a headline trend next to clicks, not instead of them. A few rules keep it honest:
- Report changes in percentage points. "Visibility 38.2%, up 2.1 points" is clearer than "up 5.8%", which readers mistake for a traffic change.
- Show it as a trend. One number means little; a line over months, with the keyword set fixed, shows direction.
- Split it. Non-brand vs brand, by device, and by keyword group (product line, market, topic cluster). A rising total can hide a group that's falling.
- Pair it with clicks. If visibility rises while clicks don't, check CTR: an AI Overview or other search feature may be taking clicks at the same positions. Our post on zero-click searches covers how to spot that.
- State the method once. Keyword count, curve, window and any set changes, in a footnote. It saves a meeting.
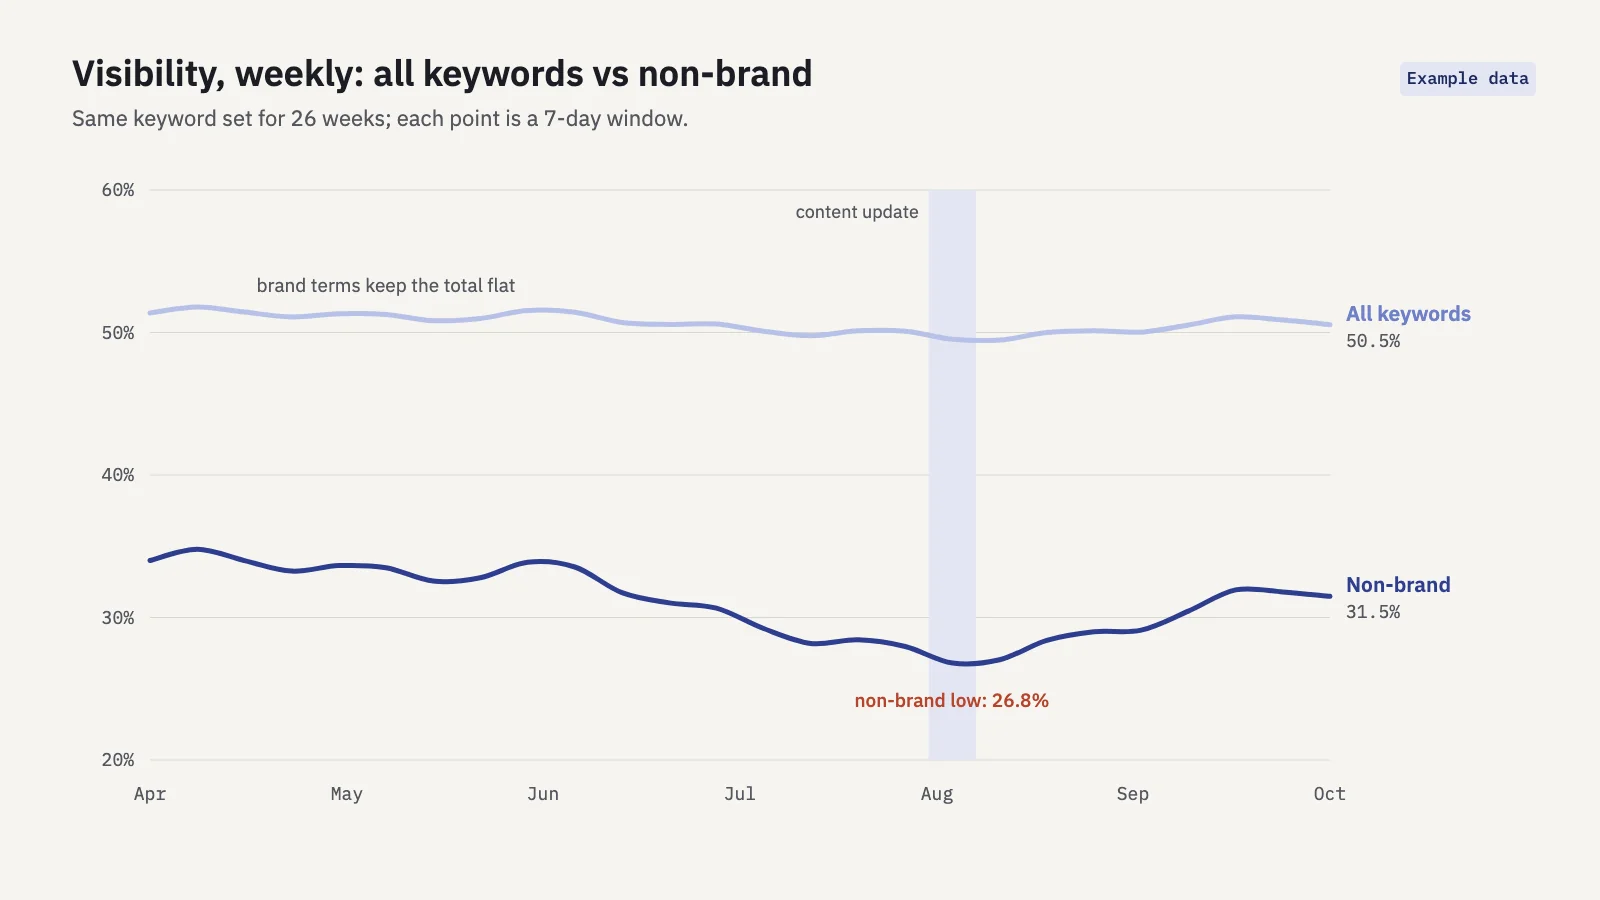 Brand terms keep the total flat while non-brand visibility drops and recovers. Example data.
For where it fits in a monthly report, see the SEO report template and the list of SEO KPIs worth tracking.
Visibility in Serplyze
Serplyze calculates visibility from your own Search Console data with the formula above: Σ(impressions × expected CTR at the keyword's position) ÷ Σ(impressions × CTR at position 1), per keyword per day. It uses one fixed reference CTR curve for every project, interpolated between positions, so scores compare across projects. The score covers the last 7 final days (days Search Console is still updating are left out) and its change is shown in points against the same 7-day window at the start of the period you're looking at.
It is calculated for every keyword group and folder, for each device, and for automatic brand and non-brand groups once you add your brand terms. Reports can include it in their summary tiles and group table.
Key takeaways
- A visibility score is the share of possible clicks your positions should earn across a keyword set: Σ(demand × CTR at your position) ÷ Σ(demand × CTR at #1).
- Tools differ because their keyword sets, demand weights, CTR curves and scales differ. Compare a score only with itself.
- From Search Console, use impressions as demand and build the CTR curve from your own non-branded clicks and impressions by position.
- Keep the keyword set fixed, split out brand terms and devices, and use a rolling window to smooth daily noise.
- Report it in percentage points, as a trend, next to clicks.
Serplyze tracks your keywords from your own Search Console data and shows visibility for every group, device and brand split, every day. Start free and see your score without the spreadsheet.