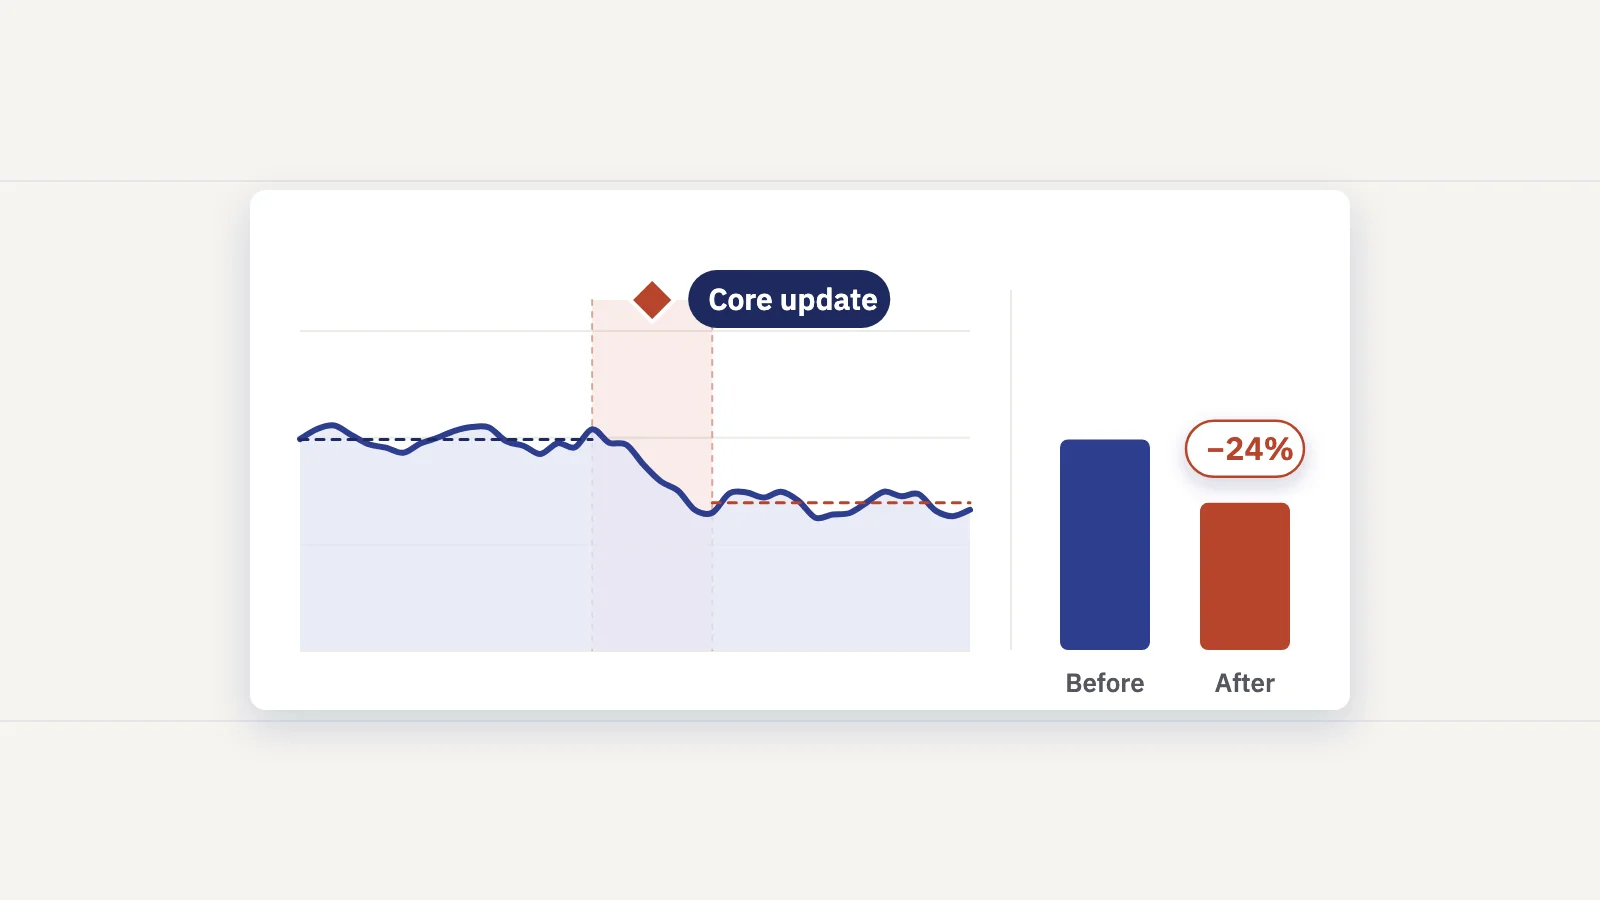
When a Google core update rolls out and your traffic moves, the first chart you see rarely tells the full story. This guide shows how to measure an update's impact in Search Console properly: clean before and after windows, the right splits, and the checks that rule out everything else.
What a core update is
Google describes core updates as significant, broad changes to its ranking systems, made several times a year. They don't target specific sites or types of pages. They change how Google assesses content overall, so some pages rise and others fall.
Two points in Google's documentation matter for measurement:
- A drop doesn't mean something is broken. Google says pages that lose ground after a core update may not have done anything wrong: other pages may simply be judged more relevant now. It isn't a manual action, so there is nothing to appeal.
- Every update has a start and an end. Each one is announced on the Google Search Status Dashboard under Ranking, with its start date and how long the rollout took. The March 2026 and May 2026 core updates, for example, each took about 12 days to roll out. The dashboard also lists spam updates and other ranking updates, which matters when two of them overlap.
Core updates are only one kind of change. Smaller updates happen all the time without an announcement, so not every wobble lines up with a named update.
Step 1: Wait until the rollout finishes
During a rollout, rankings can move up and down several times. If you measure halfway through, you measure a moving target. Check the Status Dashboard for the end date, then give Search Console time to catch up. Its most recent days are often incomplete, so don't read the last two or three days of the chart as final.
Google's own advice is to wait at least a full week after the rollout ends, then compare that week with a week before the rollout began. A week is the minimum. Four weeks on each side give a steadier picture, especially for smaller sites where a few clicks swing the percentages.
Step 2: Compare equal periods, rollout excluded
The comparison that holds up is simple: the days before the rollout began against the same number of days after it ended. Leave the rollout days out of both. They mix the old and the new rankings and blur the result.
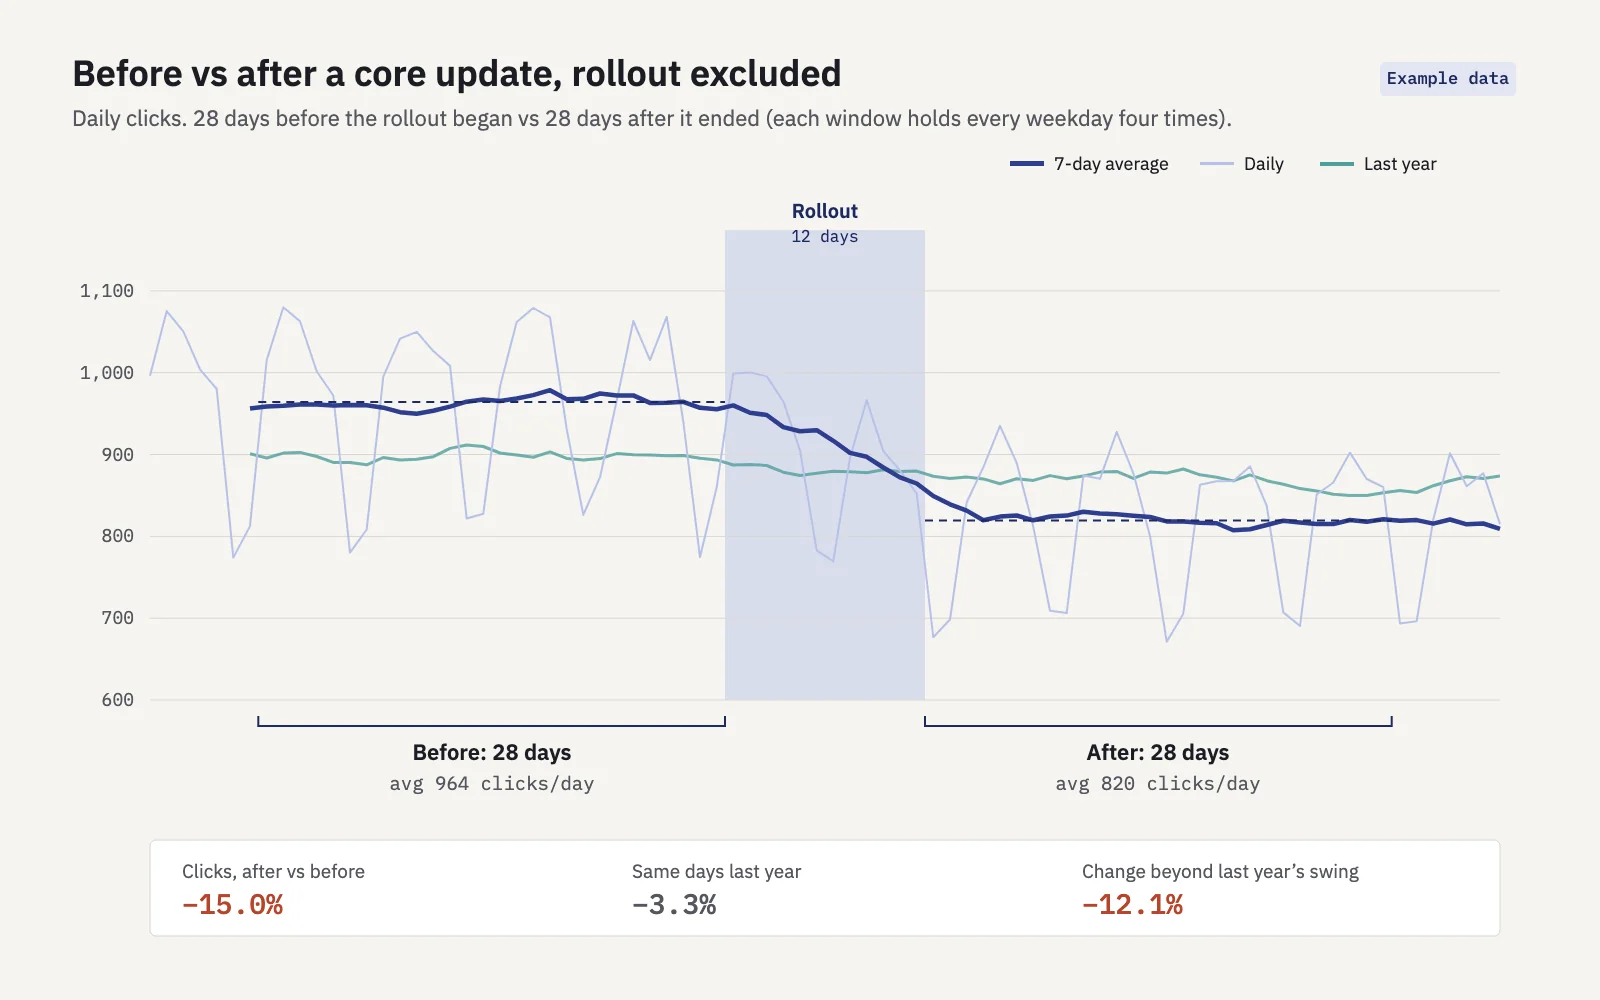
Example data. The before and after windows skip the rollout; the last-year line shows how much of the change is normal for that time of year.
Two rules keep the windows fair:
- Same length, same weekdays. Most sites get fewer clicks on weekends. A 10-day window with two weekends against a 10-day window with one is not a fair test. Use whole weeks: 7, 14, 28 or 56 days, so each window holds every weekday the same number of times.
- Check the same days last year. Shift both windows back 52 weeks (364 days, so the weekdays still line up) and see how those days moved a year earlier. If clicks always dip 5% at that time of year, a 15% drop is a 10-point problem, not a 15-point one.
In Search Console:
- Open Performance > Search results and keep the search type on Web. Images, Video and News are separate search types; check them separately if they matter to you.
- Click the Date filter, choose Compare, then Custom. Set the first range to the days after the rollout ended and the second to the same number of days before it began.
- Turn on all four metrics: clicks, impressions, CTR and average position.
- Open the Queries and Pages tabs. With a comparison active, the tables show both periods and a difference column you can sort by.
- For the last-year check, run the same comparison again with both ranges moved back 364 days. Search Console keeps 16 months of data, so this works for any update in the last few months.
Step 3: Split the change by segment
A site-wide number hides where the change happened. Split it the way Google's guide to debugging traffic drops suggests: by query, page, country, device and search appearance. At each level, open the segment that lost the most and split again.
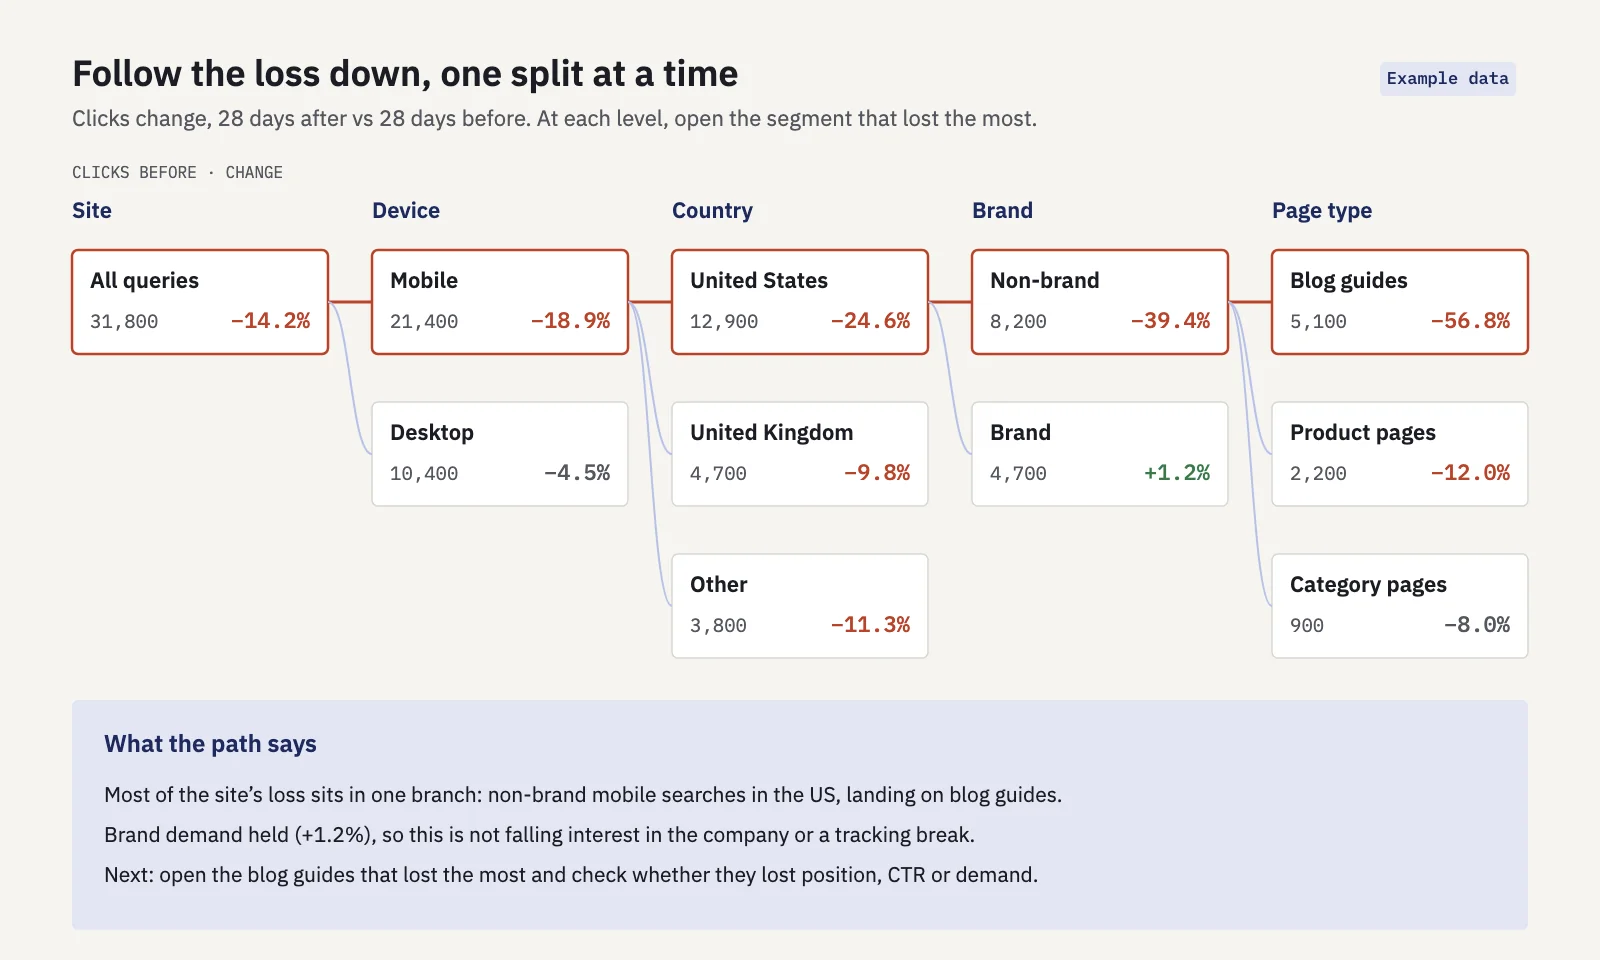
Example data. Each level opens the segment that lost the most.
- Device. Use the Devices tab or a Device filter. Results pages look different on mobile and desktop, and an update can treat them differently.
- Country. If you serve several markets, an update may land in one country first or hit one harder.
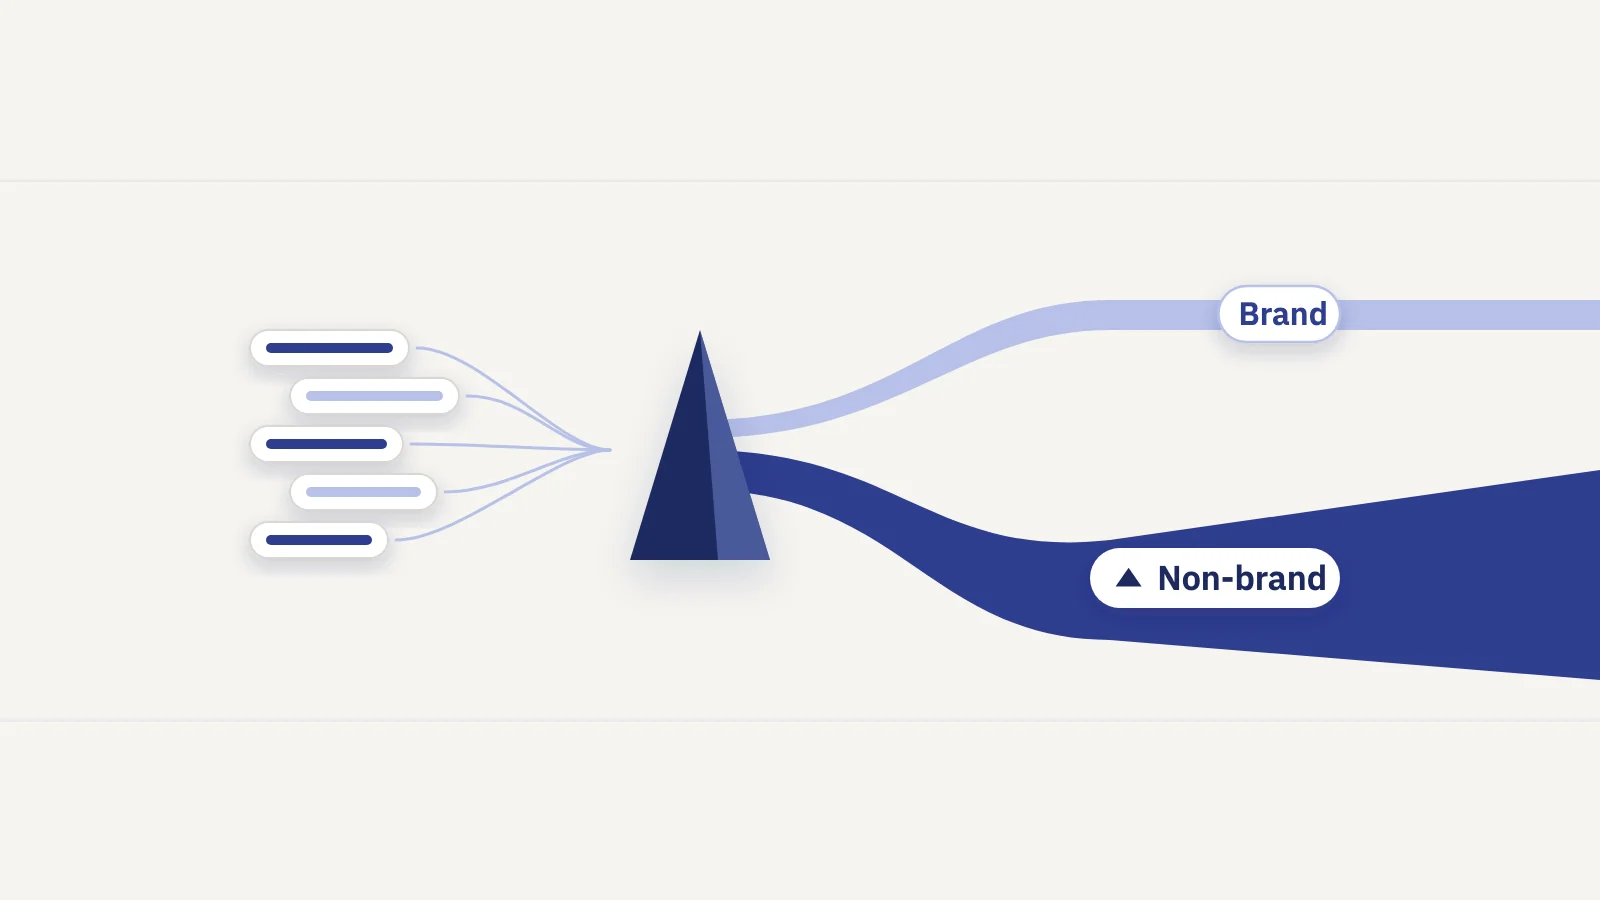
- Brand vs non-brand. Branded queries usually hold up through core updates, because people looking for you still find you. Use the branded queries filter where your property has it, or a Query filter with a regex that excludes your brand terms. If brand clicks fell too, look at demand or tracking before blaming the update. Our guide to branded vs non-branded traffic covers the split in detail.
- Page type. Group URLs by template or folder: blog posts, product pages, category pages, tools. A Page filter with "URL contains /blog/" works for a quick check. Core updates often move one type of content more than others.
- Query group. Group queries by topic or intent: how-to questions, comparisons, product names. A topic where you lost most of your rankings says more than a site total. Keyword clustering is one way to build the groups.
Step 4: Separate position, CTR and demand
Clicks can fall for three different reasons, and they call for different responses. Look at each lost query or page and read the four metrics together:
| What you see | What it usually means | What to check next |
|---|---|---|
| Position worse, impressions down, clicks down | You lost rankings | Which pages now outrank you, and what they do better |
| Position stable, impressions down | Fewer people searched | Google Trends for the query; last year's same days |
| Position stable, impressions stable, CTR down | The results page changed | New AI Overviews, snippets, ads or other features above you |
| Position better, clicks down | Mix effect | New impressions at low positions, or lost impressions at the top |
Read average position with care. It's weighted by impressions, so gaining many new impressions on page three makes the average look worse even if no ranking dropped. Look at single queries rather than the site average; our guide to average position in Search Console explains why.
Google also sets a threshold for concern. A slip from position 2 to 4 doesn't call for drastic action. A fall from 4 to 29 does call for a closer look.
Step 5: Concentrated or broad?
Sort the Pages tab by the clicks difference and add up how much of the total loss the top few pages account for. The answer changes what you do next.
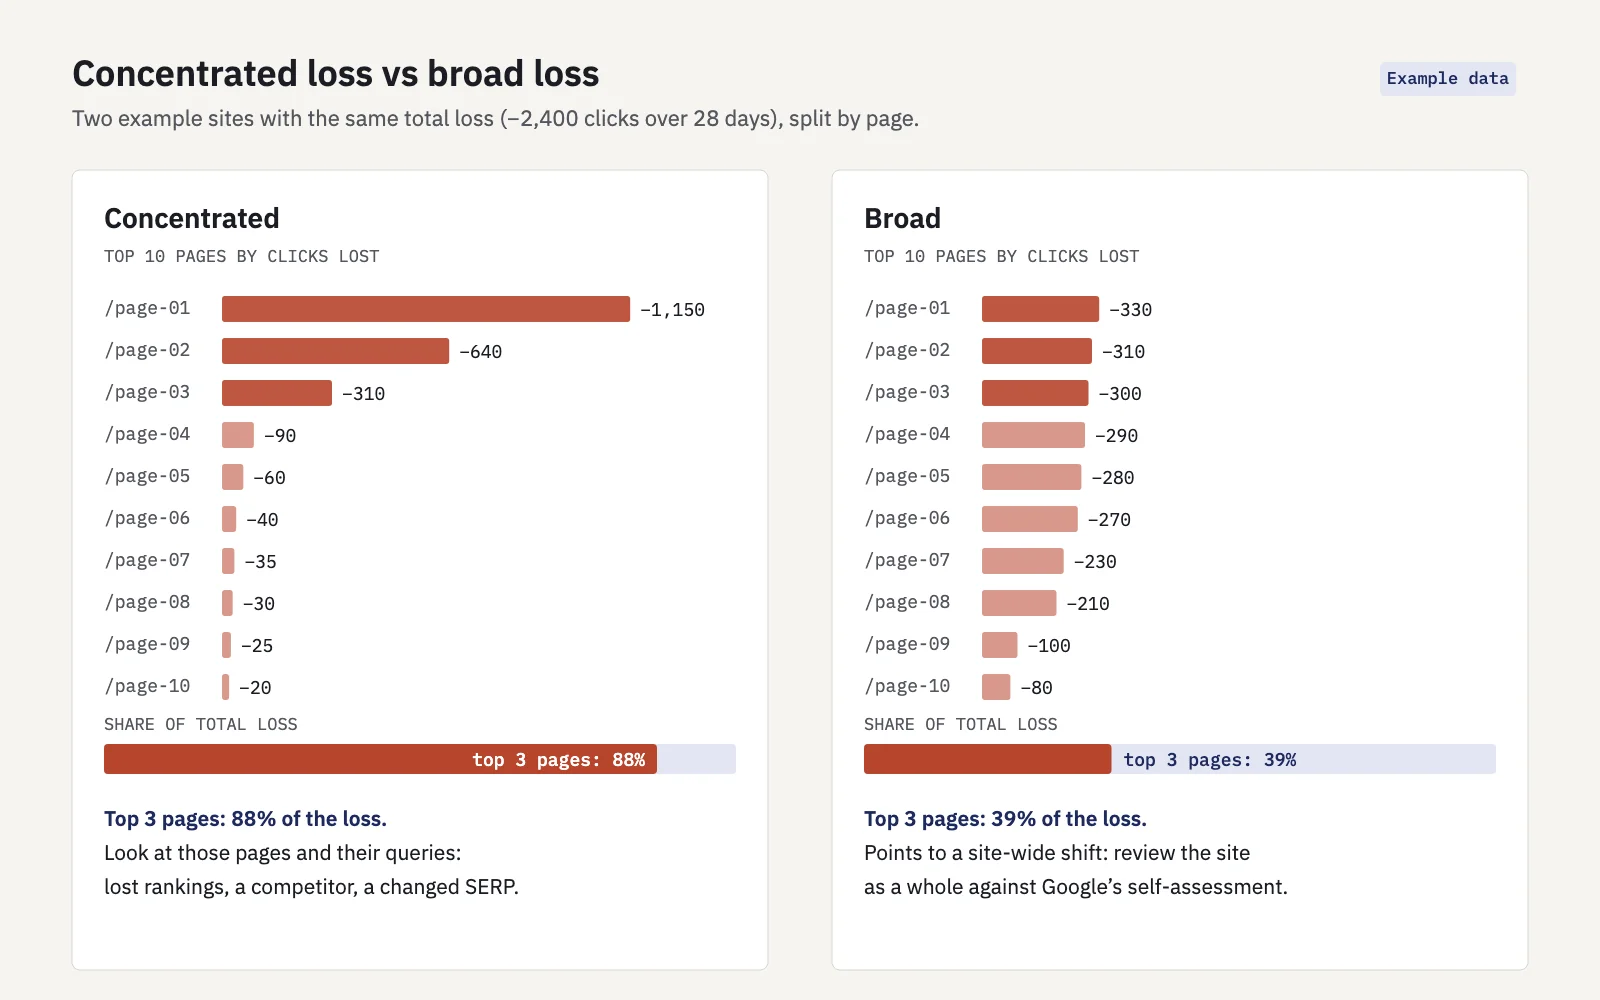
Example data. Same total loss, different diagnosis.
- Concentrated. A few pages carry most of the loss. Look at those pages and their queries: who outranks them now, whether the results page changed, whether the content still matches what searchers want. The rest of the site is probably fine.
- Broad. The loss is spread thinly over many pages. That points to a change in how Google assesses the site as a whole, and it is where Google's self-assessment questions come in.
Step 6: Rule out other causes
An update in the same weeks as a drop doesn't prove the update caused it. Before you conclude anything, check the usual alternatives:
- Technical issues. Look at the Page indexing and Crawl stats reports for a rise in errors, blocked pages or server problems in the same period. Check Manual actions and Security issues too. A robots.txt mistake or a broken release can look exactly like an algorithm hit.
- Your own changes. Migrations, redesigns, template changes, internal linking changes and content removals all move traffic. Check your release notes for the before and after windows.
- Seasonality and demand. Compare with the same days last year, and look up the biggest lost queries in Google Trends. If interest fell everywhere, your rankings may be fine.
- Tracking. If analytics shows a drop but Search Console clicks held, the problem is measurement: a broken tag, a consent banner change or a filter. Search Console counts clicks on Google's side, so it doesn't depend on your tracking code.
- Overlapping updates. If a spam update or another ranking update rolled out in the same windows, you can't separate their effects. Say so in your report.
What to do, and what not to do
If the loss is small or concentrated in a few pages that slipped a few positions, Google's advice is to avoid drastic changes, especially to content that is already doing well. Rankings move, and a page that slipped two places may come back without any work.
If the loss is large and broad, review the site against Google's self-assessment questions. They ask whether content offers original information or analysis, shows first-hand expertise, leaves readers satisfied, and is made for people rather than mainly to attract search visits. Google suggests asking someone unaffiliated with the site to assess it honestly, and starting with the pages that lost the most.
What not to do:
- No quick fixes. Removing page elements, changing word counts or rewriting titles because someone said it helps won't address a broad quality assessment. Google warns against this and recommends meaningful improvements for users instead.
- Don't mass-delete content as a first move. Google calls deletion a last resort. Improve or consolidate first; for pages that steadily lose ground over time, see our guide to content decay.
- Don't expect an instant rebound. Some improvements show within days, but Google says it can take several months for its systems to recognize that a site has improved, and some recovery may only come with the next core update.
How to annotate updates in reports
A drop on a chart without context invites the wrong conclusion. Mark updates where people read the numbers.
- In Search Console. Right-click the Performance chart and choose Add annotation to add a note on a date, up to 120 characters. Everyone with access to the property sees it, so keep it factual.
- What to record. The update's name, its rollout start and end dates, and a link to its Status Dashboard page. Log your own changes the same way: releases, migrations, content updates. When a drop and a release share a week, both belong on the chart.
- In client and management reports. Shade the rollout period on the chart rather than adding a single line, and state the comparison next to it: the before and after windows, the change, and the same days last year. Phrase it as "during the update", not "caused by the update". Our SEO report template shows where this fits.
Serplyze adds the markers for you. It reads Google's Search Status Dashboard feed once a day and draws each ranking update as a diamond on the start date with a shaded band over the rollout, on the traffic, keyword, page and AI search charts. The tooltip links to Google's incident page, and report PDFs print the markers with a legend. See Google updates and notes for details.
With the Agency add-on, Serplyze's Google update impact page runs steps 1 and 2 for every project in a workspace at once. For a completed update it compares 14, 28 or 56 days before the rollout began with the same number of days after it ended, using final Search Console data only. It shows the same days a year earlier, the non-brand change, and any other updates or logged actions that overlap the windows. Open a project to see its biggest gaining and losing tracked queries and ranking pages. The page itself says it shows what happened during the update, not what the update did.
Key takeaways
- Wait until the rollout has finished and Search Console's data is final before measuring.
- Compare equal windows of whole weeks before the rollout began and after it ended, and check the same days last year.
- Split by device, country, brand vs non-brand, page type and query group, following the biggest loss down.
- Decide whether clicks fell because of position, CTR or demand; each needs a different response.
- A loss in a few pages calls for a page-level look; a broad loss calls for Google's self-assessment, not quick fixes.
- Rule out technical issues, your own changes, seasonality and tracking, and annotate updates on every chart you share.
Serplyze tracks your keywords from your own Search Console data and marks every Google ranking update on your charts, so a drop always comes with its context. Start free and see how your site moved through the last update.