Content decay is the slow loss of search clicks on a page that used to perform well. It rarely shows in your site total, because new pages cover the loss, so you have to look for it page by page in Search Console.
What content decay looks like
A decaying page loses a little every month. There is no single bad week: clicks drift down over three, six or twelve months as the page ages, competitors publish newer versions and the results page changes around it.
Two other patterns look similar on a short chart and need a different response:
- Seasonality. Clicks fall in the same months every year and come back. A gift guide in February or a tax page in the summer is not decaying; it is out of season.
- A sudden drop. Clicks fall off a cliff within a week or two. That points to a specific event: a Google update, a page that dropped out of the index, a redirect or a migration that went wrong, a broken template. You investigate the date, not the content.
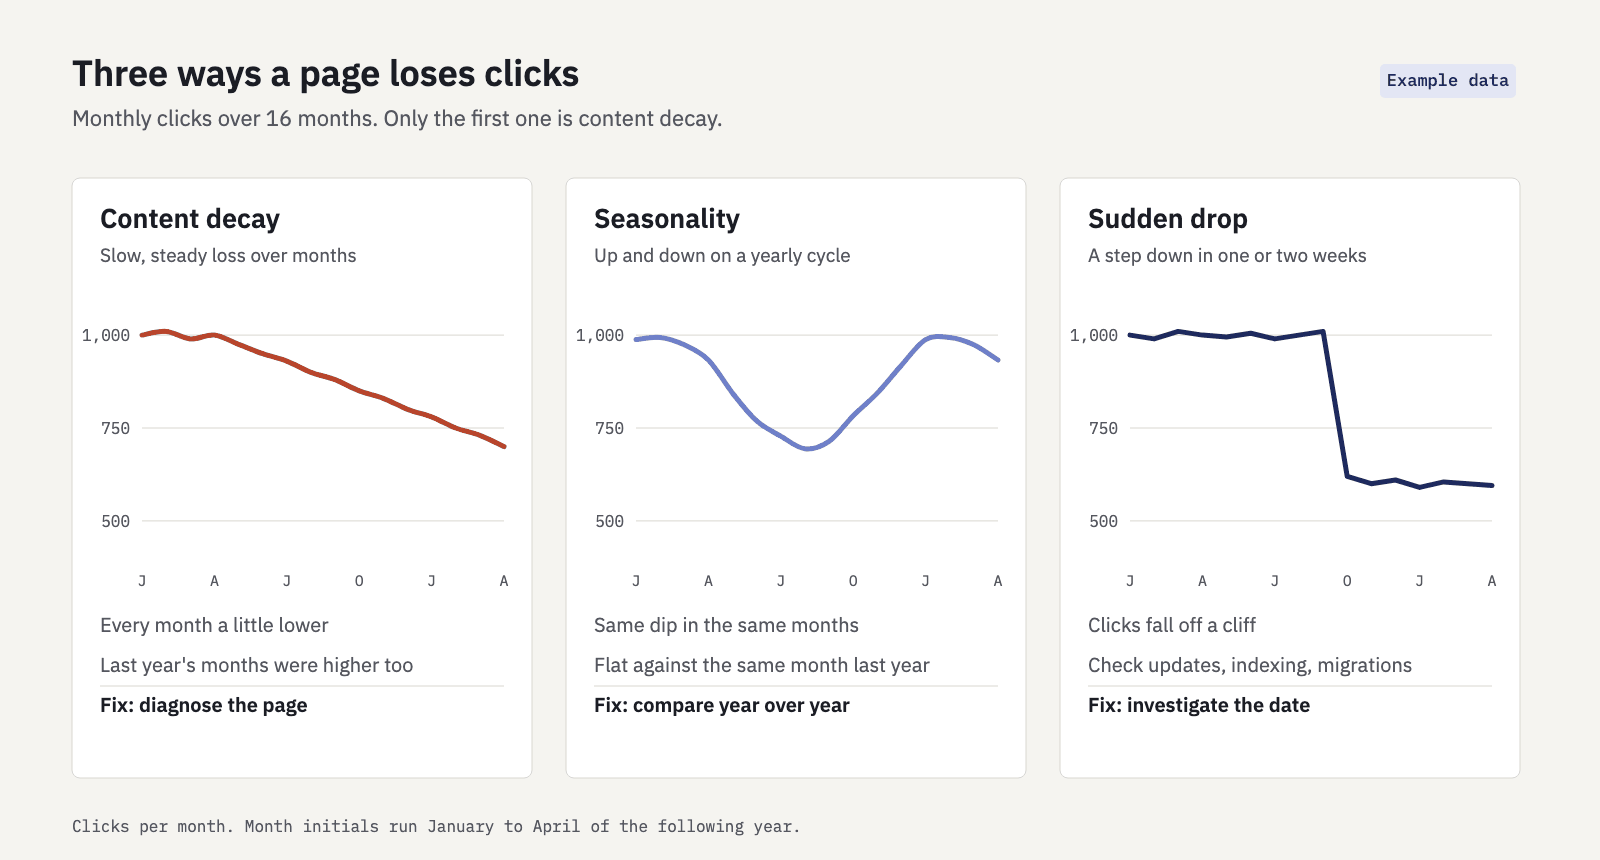
The test that separates them is simple: compare against the same months last year, and look at the shape of the decline. Decay is down year over year and gradual. Seasonality is flat year over year. A sudden drop has a date you can point to. If you suspect the date lines up with a Google update, our guide to core update impact in Search Console covers that case.
How to find decaying pages in Search Console
Search Console keeps 16 months of data, which is enough for one year-over-year comparison. The Pages tab of the Performance report is where decay shows.
- Open Performance > Search results and keep the search type on Web.
- Set a year-over-year comparison. Click the Date filter, choose Compare, and set the last 3 months against the same 3 months a year earlier. Comparing with the previous 3 months instead would mix decay with seasonality.
- Open the Pages tab. With a comparison active, the table shows clicks for both periods and a Difference column (Google's help on comparisons). Sort by the clicks difference so the biggest losses come first.
- Apply thresholds so you don't chase noise (see below).
- Check the trend shape. For each candidate, add a Page filter for that URL, remove the comparison and set the date range to 16 months. A steady slope is decay; a step is a sudden drop; a wave is seasonality.
- Open the Queries tab with the page filter still on and compare the two periods again. This tells you why the page lost clicks (next section).
- Export for larger sites. The UI exports up to 1,000 rows. If you have more pages than that, use the Search Console API, Looker Studio or the bulk export to BigQuery.
Set thresholds before you look
Without thresholds, the list fills up with pages that went from 6 clicks to 2. A reasonable starting point:
| Filter | Starting value | Why |
|---|---|---|
| Clicks in the earlier period | At least 100 a month | Below that, swings are noise |
| Year-over-year change | Down 25–30% or more | Small declines are normal variance |
| Shape over 16 months | Gradual, not a step | Steps are incidents, not decay |
| Position on the main queries | Note it, don't filter on it | It tells you the cause, not whether there is a loss |
Adjust the numbers to your site's size. A site with 500 clicks a month needs lower thresholds than one with 500,000.
Check what changed: queries, position or CTR
With the page filter set and the year-over-year comparison on, the Queries tab shows which of three things moved:
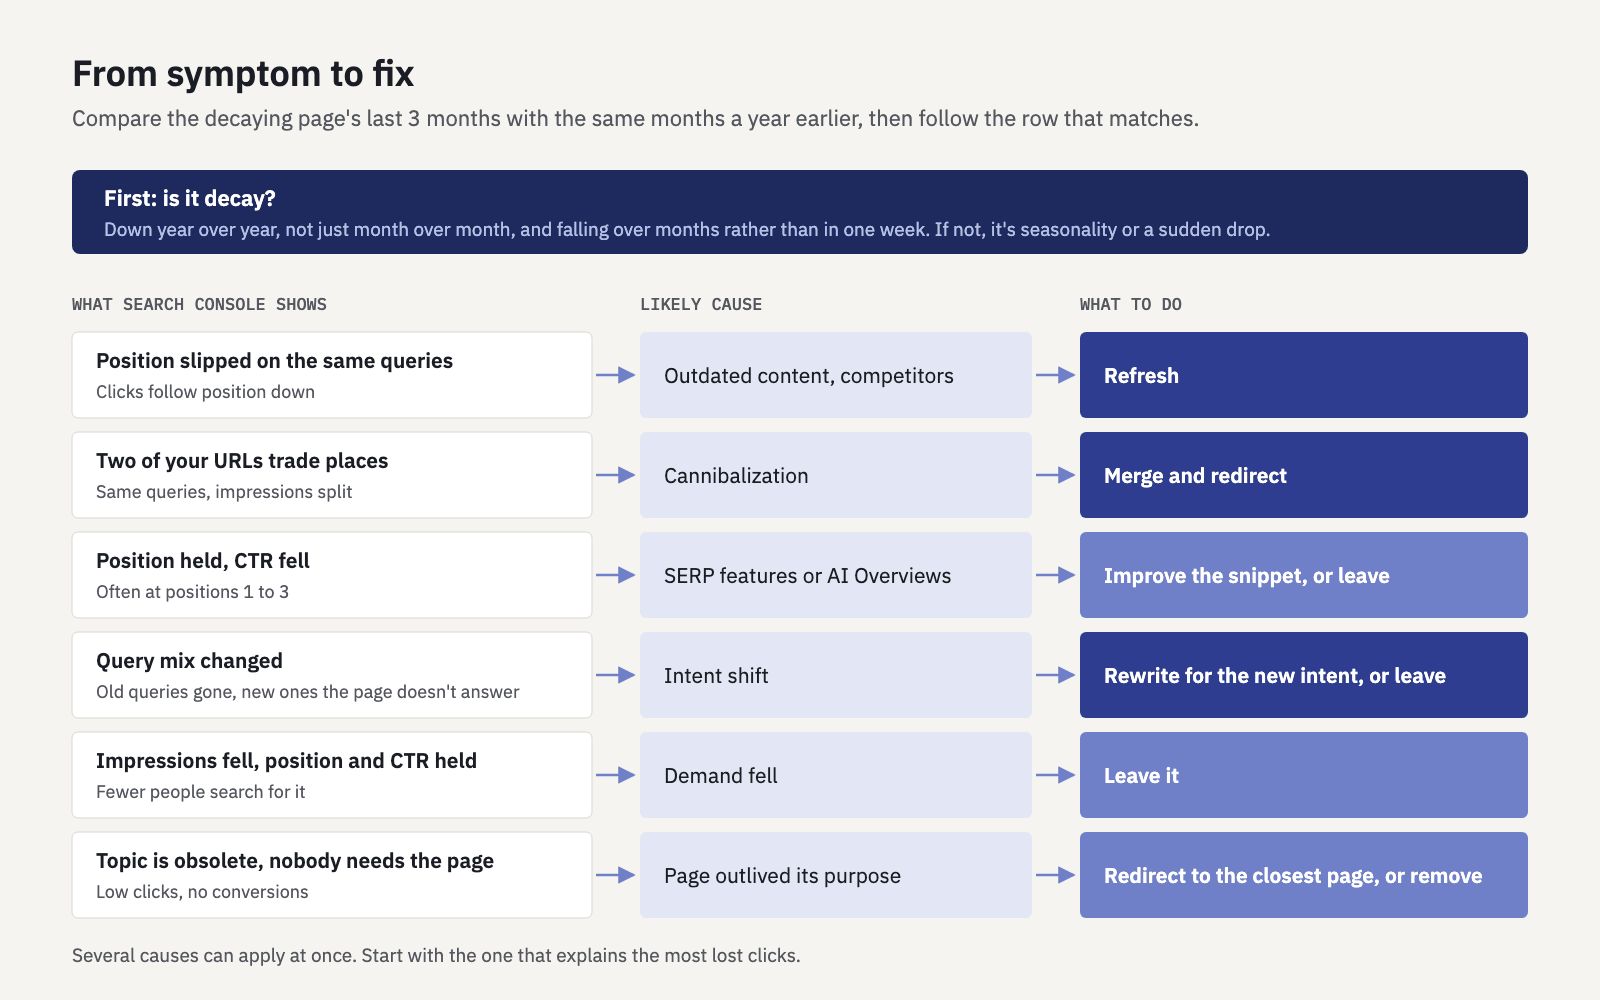
- Position fell on the same queries. The page still ranks for what it ranked for, but lower. Clicks follow position down.
- Position held, CTR fell. You rank where you did, but fewer people click. Something on the results page above you is taking the clicks.
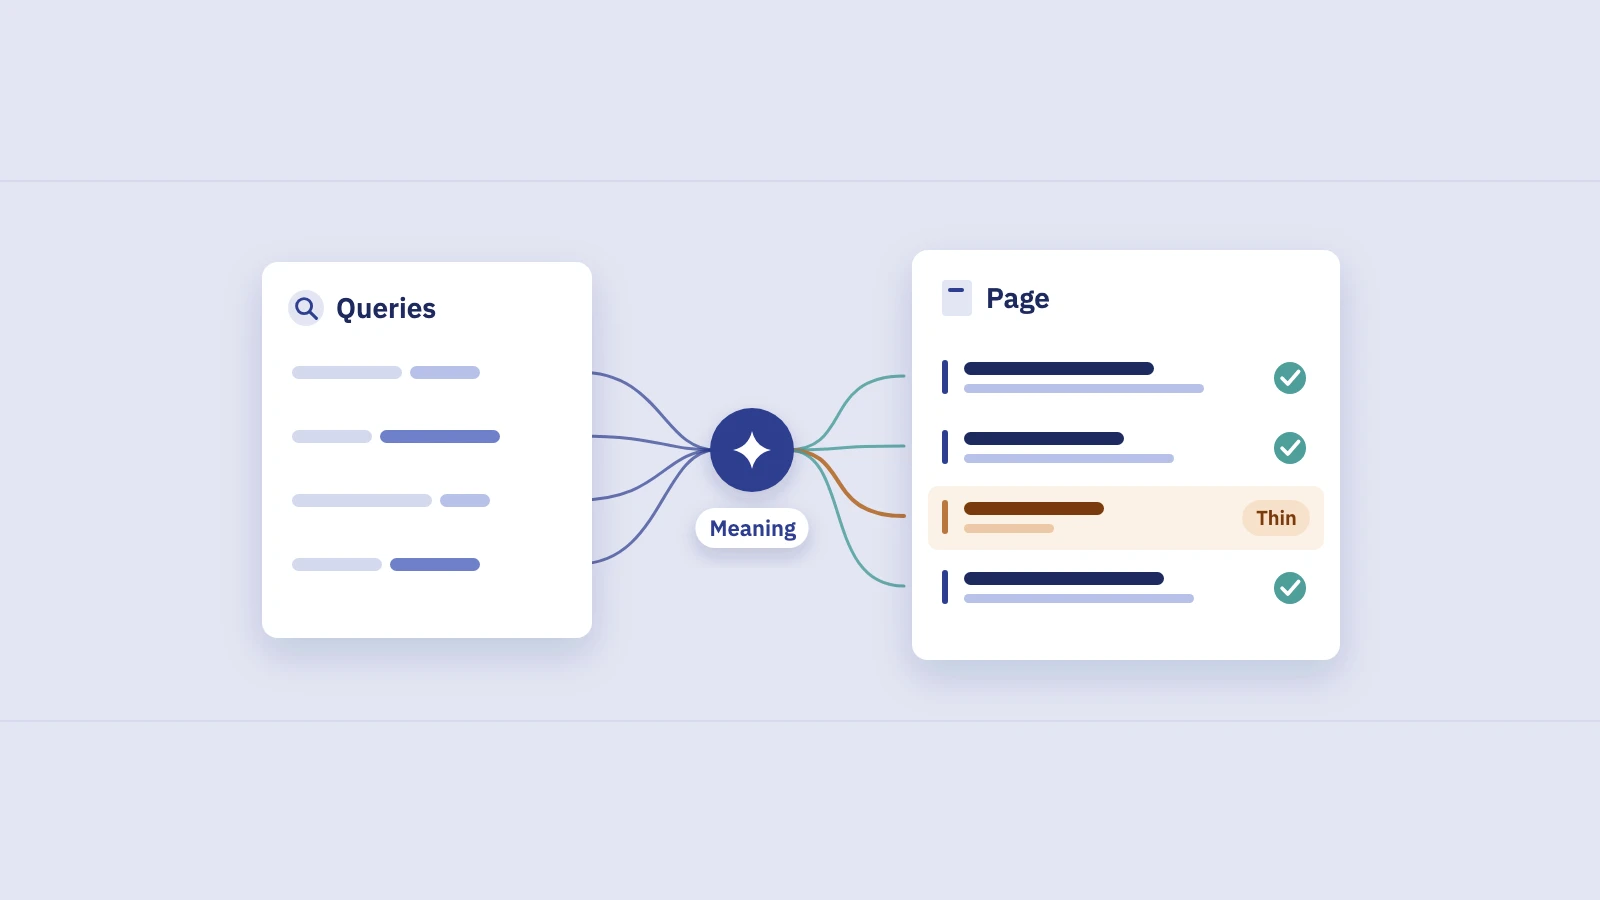
- The query mix changed. The queries that used to bring clicks are gone or much smaller, and new ones appear that the page doesn't answer well. Either demand moved or Google now reads the intent differently.
Also check impressions. If impressions fell while position and CTR held, fewer people are searching for the topic, and no rewrite will bring those searches back.
Look at average position per query, not per page. A page's average position mixes every query it appears for, so a new long-tail query at position 40 can make the page look like it dropped. Our guide to average position in Search Console explains why.
Diagnosing the cause
The pattern in the Queries tab points to the cause. The common ones:
Outdated content. Prices, screenshots, years in the title, steps for a tool that has changed. Searchers notice, and so do competitors who publish the current version. Usually shows as a slow slide in position on the page's main queries.
Stronger competitors. Someone published a more complete or more useful page. Search the main queries yourself and read the pages now above you: what do they cover that yours doesn't?
Intent shift. The same query now wants a different kind of page: a tool instead of an article, a comparison instead of a definition, a product list instead of a guide. The results page tells you. If the top results are all a different format, your format is the problem.
Cannibalization. A newer page on your own site competes with the old one for the same queries. In the Queries tab, filter by one of the queries and open the Pages tab: if two of your URLs share its impressions and trade places, that's the cause. The keyword cannibalization guide walks through confirming and fixing it.
SERP features and AI Overviews. Position held but CTR fell, often at positions 1 to 3. An AI Overview, a featured snippet, more ads or a video block now sits above you. Google counts clicks and impressions from AI Overviews inside the normal Web search type of the Performance report (Google's AI features documentation), so Search Console won't tell you which feature took the clicks; it only shows that the clicks went somewhere while your rank didn't change. Our post on zero-click searches covers how to measure this.
What to do: refresh, merge, redirect or leave it
Each cause has a default response.
Refresh when the page is still the right page for the query but has fallen behind. Update facts, examples and screenshots, cover what the top results cover that you don't, cut sections that no longer apply and fix the title and description so they match how people search now. A refresh is a real edit, not a new date: Google's guidance on helpful content asks whether you are changing the date of pages to make them seem fresh when the content hasn't substantially changed. Only change the visible date when you changed the page.
Merge when two of your pages split the same queries. Pick the stronger URL, move the useful parts of the weaker one into it, and redirect the weaker one.
Redirect when a page is obsolete but a close replacement exists, or after a merge. Use a permanent server-side redirect (301 or 308); Google treats it as a signal that the target should be the canonical URL. Redirect to the closest equivalent page, not to the home page.
Rewrite when intent shifted and the query still matters to you. That usually means a new format, not more words: a template, a comparison table, a calculator.
Leave it when demand fell, when an answer on the results page now satisfies the search and the page never converted, or when the page is still doing its job at a lower level. Not every decline is worth a rewrite.
How to prioritise
A list of 40 decaying pages is not a plan. Rank it by two things.
Clicks lost, not percent lost. A page that went from 3,000 to 1,800 clicks a month lost 1,200 clicks. A page that went from 80 to 20 lost 75%, but only 60 clicks. Sort by the absolute loss first.
Business value. A product or pricing page that lost 200 clicks may be worth more than a blog post that lost 1,000. If you have conversion or revenue data per landing page, weight the click loss by it. If you don't, a rough tier (money pages, supporting pages, everything else) works.
Then start where both are high, and batch similar fixes: five outdated guides in the same section are often one afternoon's work.
Finding decay in Serplyze
Serplyze has a content decay heatmap built from your Search Console data. It lists your top pages by clicks (the top 100 on Free, 500 on paid plans) against each month of the range you pick: 3, 6, 12 or 16 months. Each month is measured in clicks per day, so short and long months compare fairly, and each cell shows that month as a share of the page's own best month in the range.
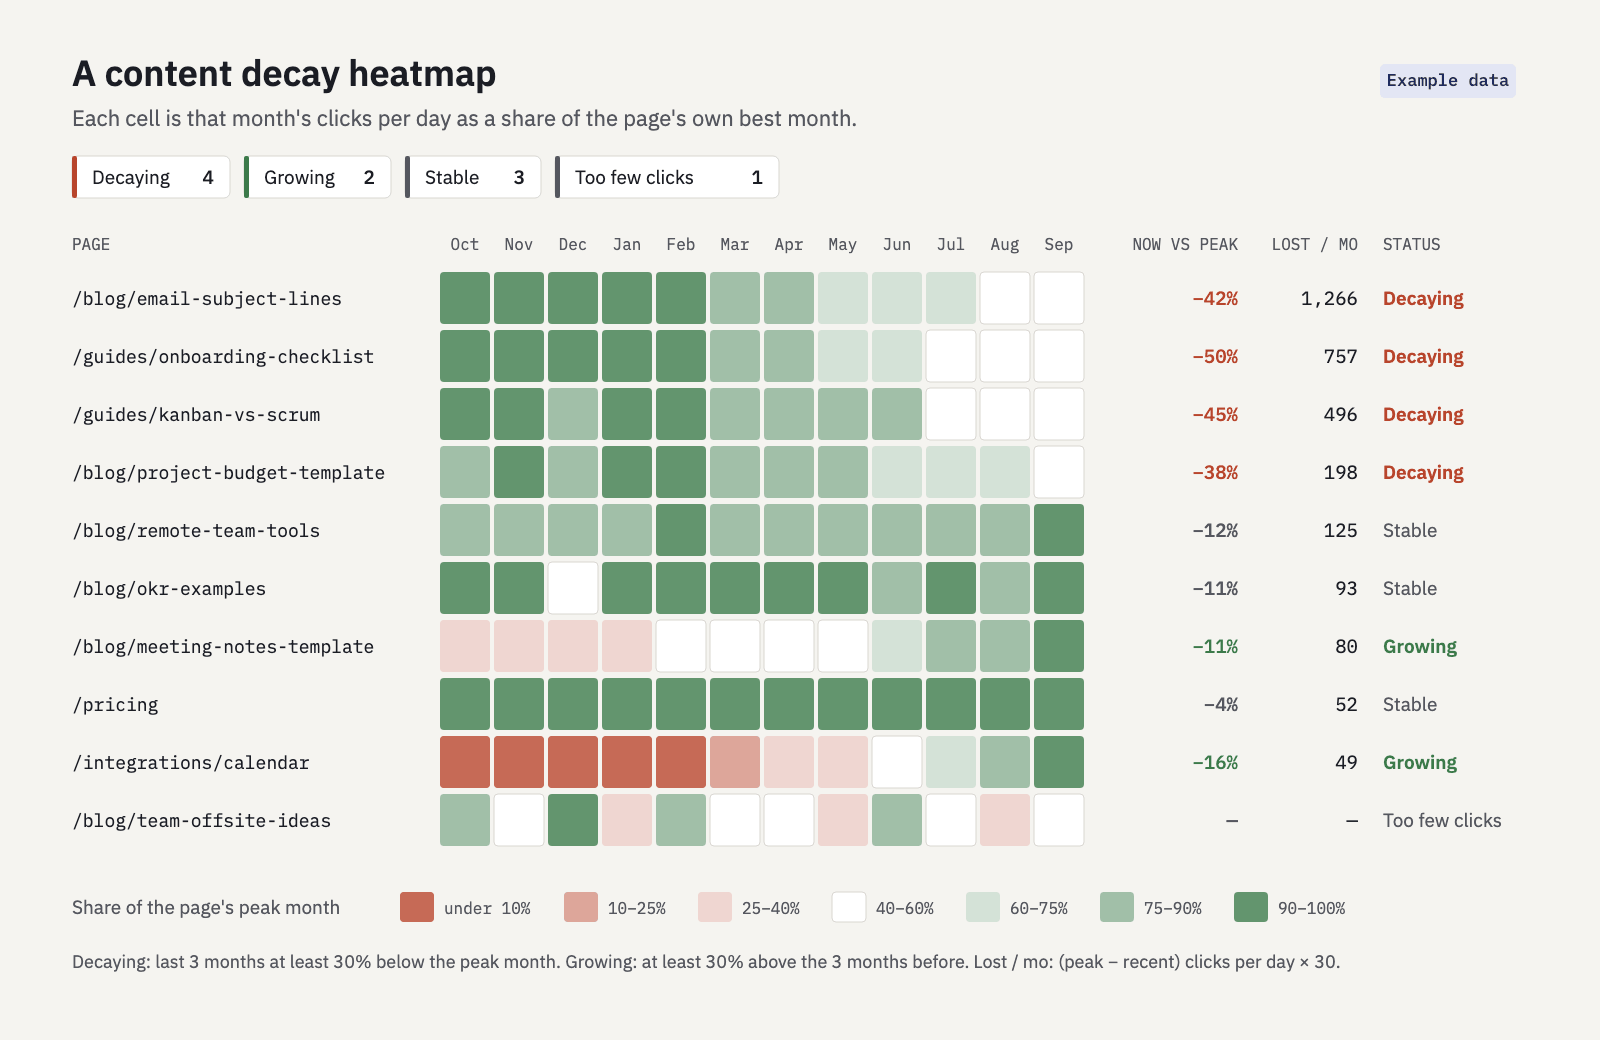
Each page gets a label from its last 3 months:
- Decaying: clicks per day at least 30% below the page's peak month.
- Growing: at least 30% above the 3 months before.
- Stable: neither.
- Too few clicks: fewer than 30 clicks over the range, not scored.
The default sort is clicks lost per month against the peak, which is the "absolute loss first" rule above. You can filter by URL or regex to check one section, export the view to CSV, and open any page for its queries and daily trend. It shows that a page is losing clicks, not why, so the diagnosis steps above still apply.
Measuring a refresh
Record the date you published each refresh and what you changed. Then:
- Wait before judging. Google has to recrawl the page and rankings need time to settle. Give it a few weeks before reading anything.
- Compare equal windows. Take the same number of days before and after the change, leaving out the days right after the edit.
- Check against the site. If the whole site rose 10% in the same weeks, a page that rose 10% didn't benefit from the refresh. Compare the page's change with the site's.
- Watch the same queries. Did position on the main queries recover, did CTR improve, did the page pick up the new queries you wrote for?
- Look again at the same months next year. The year-over-year view is the cleanest check that the decay actually stopped.
In Serplyze, each page row in the decay heatmap has a link to log the update as an action. On paid plans, Actions compare the 28 days after the change with the 28 days before (after a 7-day lag by default) for clicks, impressions, CTR and position, next to the whole site's change in the same windows. A before and after comparison shows correlation, not proof: a Google update in the same weeks can move the numbers too.
Key takeaways
- Content decay is a gradual loss of clicks over months; check it year over year to rule out seasonality, and look for a date to rule out a sudden drop.
- In Search Console, compare the last 3 months with the same months last year in the Pages tab, sort by the clicks difference and apply thresholds.
- Open the Queries tab for each page to see whether position, CTR or the query mix changed; that points to the cause.
- Refresh outdated pages, merge cannibalizing ones, redirect obsolete ones, and leave pages whose demand simply fell.
- Prioritise by clicks lost and business value, and measure each refresh over equal windows against the site's own trend.
Serplyze builds the content decay heatmap from your own Search Console data and sorts it by the clicks each page lost. Start free and see which of your pages are fading.