
Your Search Console Performance report is a keyword research tool that only covers one site: yours. Every query in it is a search Google has already matched to your pages, with measured impressions instead of estimated volume. This guide shows how to mine it for new topics, rising demand and missing pages, and how to turn what you find into a content plan.
Why your own impressions beat generic volume estimates
Third-party keyword tools estimate monthly search volume from panels, clickstream data and ad-platform ranges. The figures are useful for comparing topics, but they're modelled, rounded and the same for everyone.
Search Console gives you three things a volume estimate can't:
- Measured demand, for your market. An impression is counted when your result appears on a results page the searcher loads, as Google explains in its metric definitions. Impressions are real searches, from the countries and devices you actually serve.
- Google's view of your relevance. Every query in the report is one Google already considered your site for. A query you appear for at position 14 is a better bet than a higher-volume one you've never been shown for.
- The long tail. Volume tools round small queries to zero or drop them. Search Console lists the four- and seven-word queries that together often add up to more impressions than the head term.
The trade-off is coverage: you only see queries you already appear for. More on that in the last section.
Seed, expand, prioritise
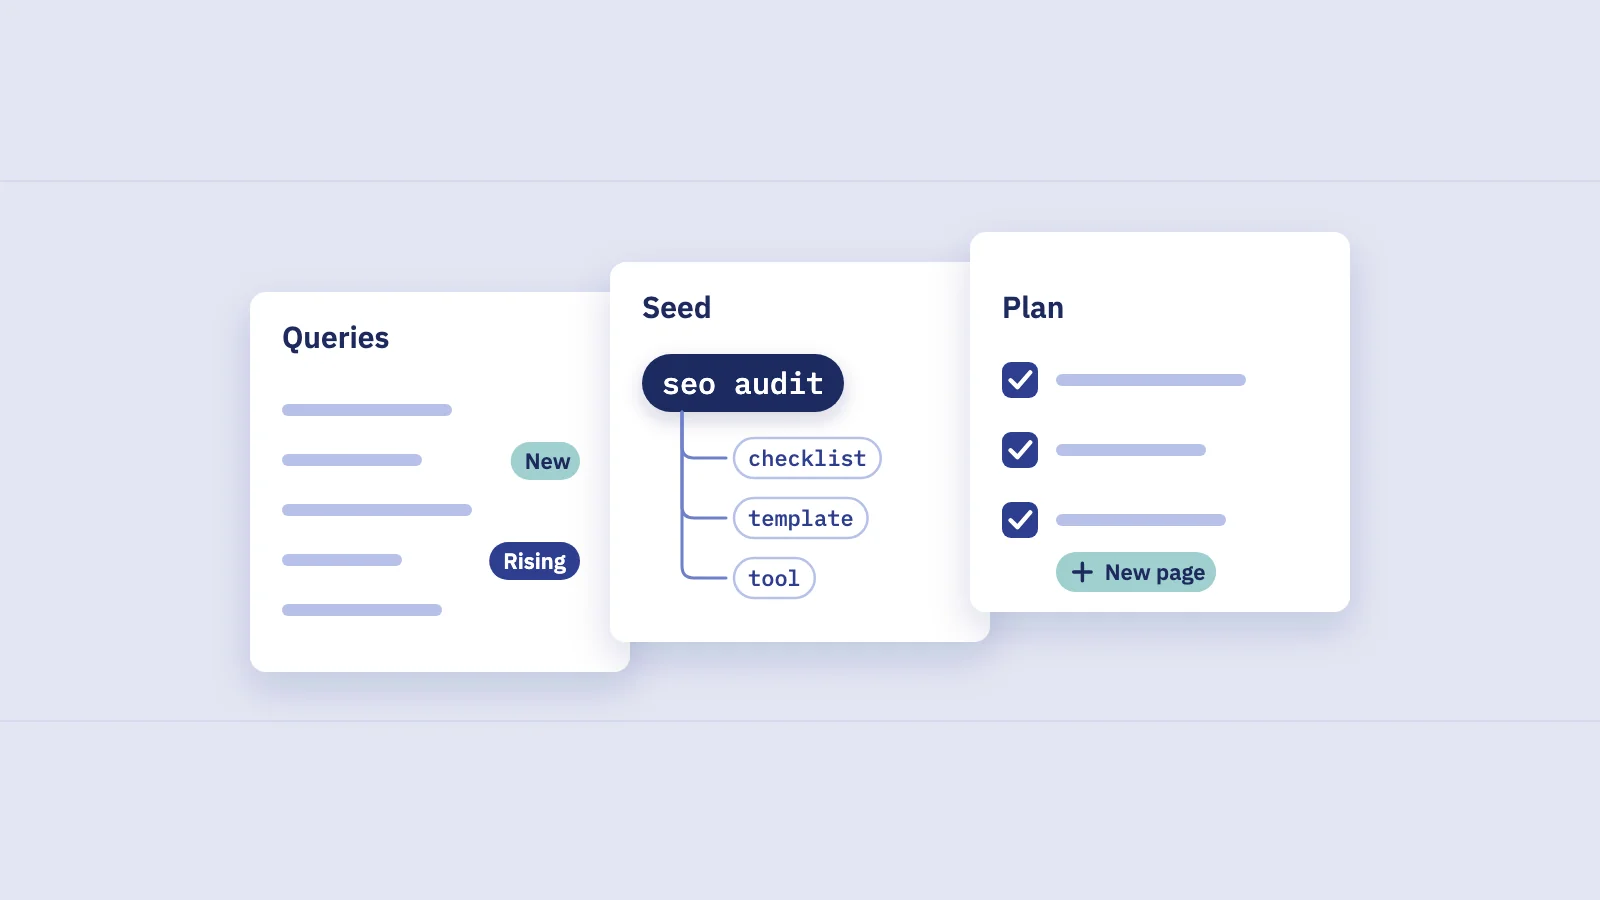
The method has three stages. First collect seed queries from your own data: new ones, rising ones, questions, and queries without a matching page. Then expand each seed into the full set of variants and modifiers people use. Then prioritise the clusters by demand, fit and effort.
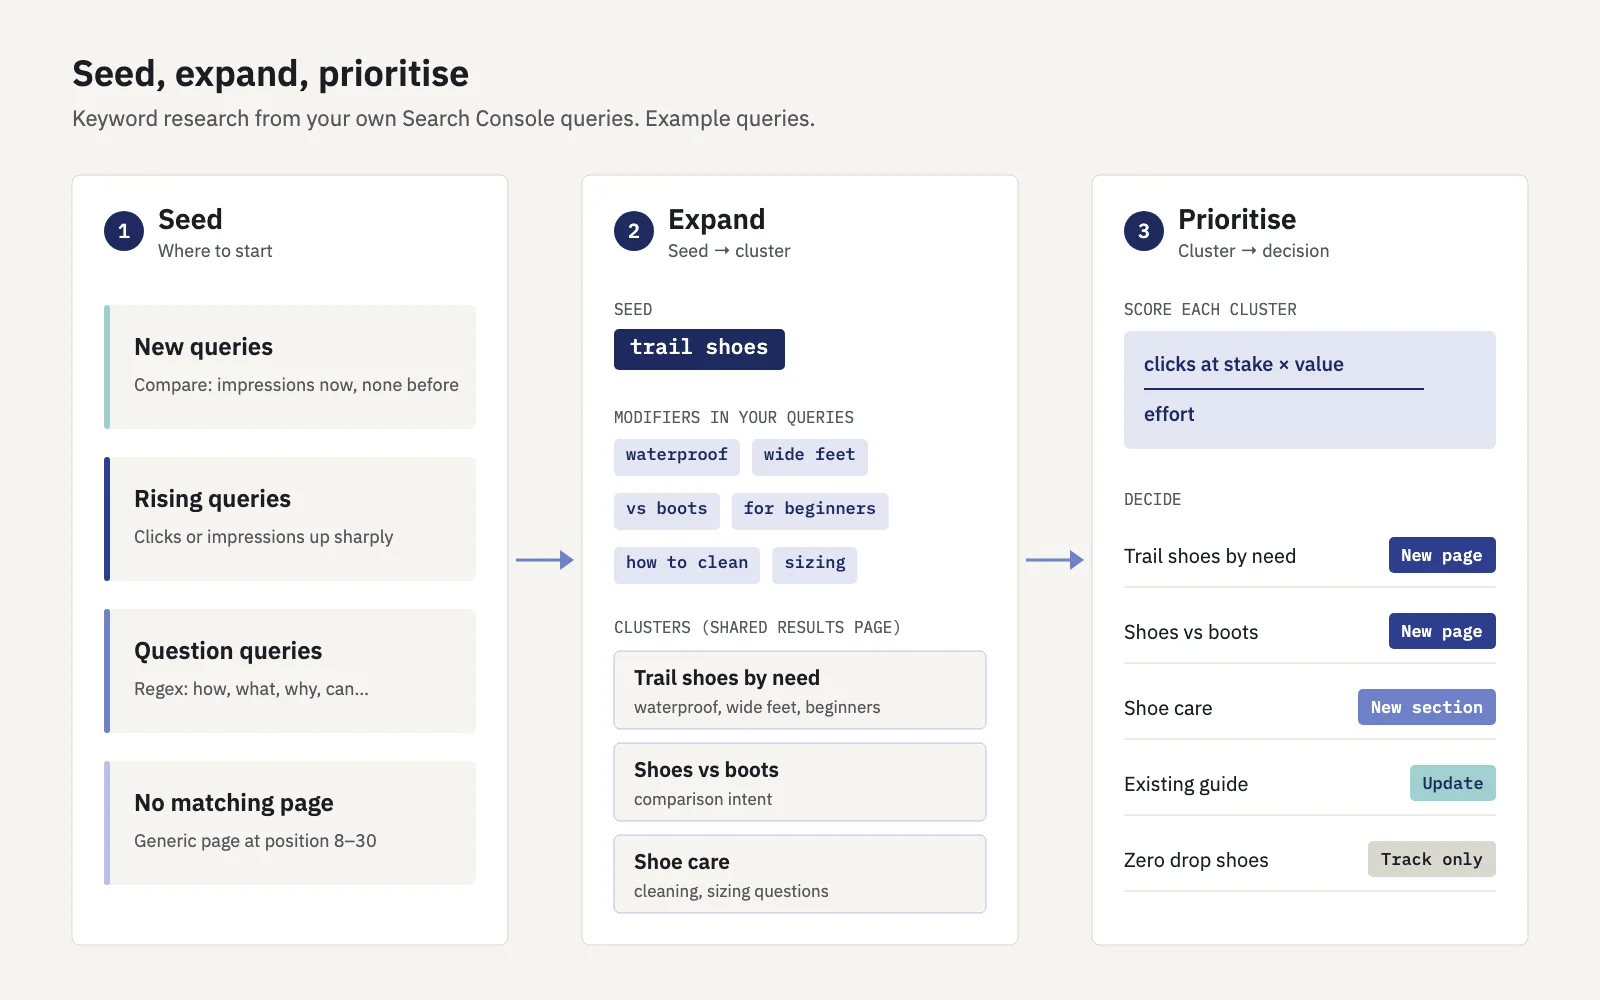 Each stage narrows the list: many seeds, fewer clusters, a short plan.
Finding new queries with the compare view
New queries are the clearest signal that demand is shifting, or that Google has started to see you as relevant for something.
- Open Performance > Search results and set the search type to Web.
- Open the Date filter and choose Compare. Pick the last 28 days against the previous 28 days (or the last 3 months against the 3 before). Search Console's filtering documentation covers how comparisons work.
- Switch the table to Queries and show Impressions for both periods.
- Sort by impressions in the earlier period, lowest first. Queries with impressions now and none before are new to your site.
- Export both periods and compare them in a sheet if the list is long. The UI shows and exports at most 1,000 rows, so on a large site a query can look "new" only because it fell outside the earlier period's top 1,000.
Serplyze runs this comparison for you. On its Traffic screen, the Queries tab has a New list: queries with impressions in the current period and none in the comparison period. Queries whose earlier numbers aren't known are left out rather than counted as new. The same screen has Growing, Losing clicks and Striking distance lists, and a Not tracked filter so you can add a new query to your rank tracker in one click.
Rising queries
A query doesn't have to be new to be interesting. One that doubled its impressions in a month tells you demand is growing, or that Google is testing you higher.
In Search Console itself, the Insights report has a "Queries leading to your site" card with top, trending up and trending down queries, ordered by the change in clicks. For impressions, use the compare view above and sort by the difference.
Serplyze's rank tracker shows Rising queries you don't track: queries you aren't tracking yet whose clicks or impressions grew by at least 30% over the last 14 finalised days compared with the 14 days before, or that are new. Each one needs at least 5 clicks or 50 impressions to qualify, comes with its main landing page, and has a suggested group to add it to.
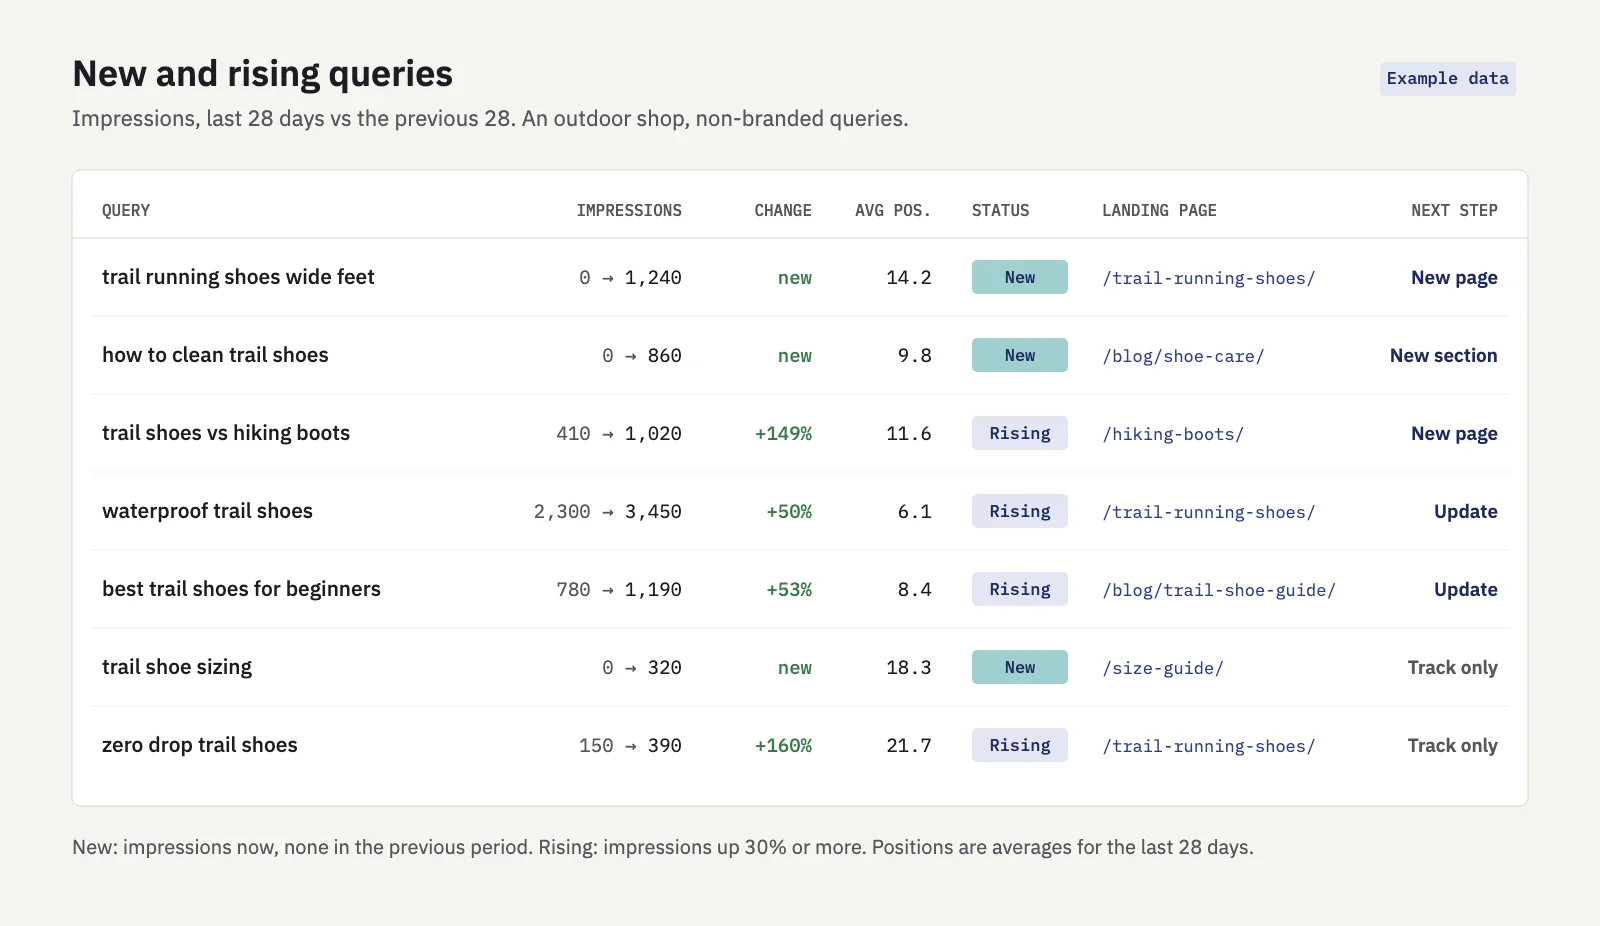 Example data. New and rising queries with the page Google shows for each.
Question queries
Questions map directly to articles, FAQ sections and help pages. Filter for them with a regex:
- Click + Add filter, choose Query, then Custom (regex).
- Enter
^(how|what|why|when|where|which|who|can|does|do|is|are|should)\sto match queries that start with a question word. - Sort by impressions and read the top 100.
Look for questions where the landing page is a product or category page, which rarely answers a question well, and for groups of similar questions that one page could answer together. Our guide to Search Console regex has more patterns, including comparisons (\b(vs|versus|or)\b) and modifiers like "best", "price" or "template".
Queries with impressions but no dedicated page
Some of your best opportunities are queries Google shows you for with the wrong page. Signs to look for:
- The landing page is generic. The homepage or a broad category page ranks for a specific question or use case.
- Position 8 to 30 with steady impressions. Google finds you relevant, but nothing on the page is a close enough match.
- Several pages share the query. Click the query, then open the Pages tab. If two or three URLs take turns, no page owns the topic (see keyword cannibalization).
The Search Console UI shows pages for one query at a time. For a full query-and-page list, use the API, Looker Studio or the BigQuery export. The content gap analysis guide walks through five gap patterns and how to turn each into a brief.
Expanding seeds into clusters
A seed is one query. A content plan needs the whole cluster around it.
- Filter by the seed's core term. Use Queries containing with the shortest form ("rank tracker", not "best free rank tracker for agencies").
- Read every row and note the modifiers. Group the words that change meaning: audiences ("for agencies"), formats ("template", "checklist"), comparisons ("vs"), price ("free", "cost") and questions.
- Group variants that share intent. "Rank tracker for agencies" and "agency rank tracking" probably want the same page. "Rank tracker" and "how to track rankings" probably don't. When in doubt, look at the results page: if the same URLs rank for both, they belong together. Keyword clustering with Search Console data covers this step in detail.
- Check seasonality. A cluster that spikes every spring needs its page live before spring. Your own 16 months show this for queries you've appeared for all year; Google Trends fills in for those you haven't.
Estimating demand from impressions
Impressions are a floor for demand, not a measure of it. How close they come depends on where you rank:
| Your average position | What impressions tell you |
|---|---|
| 1 to 5 | Close to the full demand in the countries you see: most searchers load a page your result is on |
| 6 to 10 | Most of the demand, but variable: you may drop to page two on some searches |
| 11 to 20 | A fraction of the demand: only searchers who reach page two count |
| 21 and beyond | A small sample; treat it as proof the query exists, not as a size |
To estimate what a cluster could be worth, use your own click-through rates instead of an industry table. Say a cluster earns 4,000 impressions a quarter at position 12, and your site's queries at position 3 get about 8% CTR. If the impressions roughly doubled on page one (a guess you should state), the cluster could bring around 640 clicks a quarter at position 3. That's a ceiling for ranking a new page, not a forecast, but it puts clusters in a sensible order. Good CTR benchmarks shows how to build your own CTR-by-position curve.
Search Console leaves out anonymized queries, which are too rare to report individually. On sites with a long tail, this can be a large share of impressions, so cluster totals undercount demand. See anonymized queries.
Turning findings into a content plan
Each cluster gets one of four decisions:
- New page. A cluster with real demand, a distinct intent and no page that fits.
- New section. A small cluster closely tied to a page that already ranks. Add a well-headed section instead of a thin page that competes with it.
- Update. The right page exists but ranks 8 to 20, or ranks well with a low CTR. Rewrite to cover the cluster's questions, or improve the title.
- Track only. Interesting but too small or off-strategy for now. Add it to your rank tracker and revisit next quarter.
Score the new pages and sections by clicks at stake, business value and effort, and take the top five into next month's plan. Write down the success check before you publish: which queries, which page, what position and clicks you expect in three months. Then track that cluster as a group, so you can see whether the page took over the queries.
The limit: you can't see what you don't rank for
Search Console only reports queries where your site appeared. That leaves real blind spots:
- New sites have few impressions, so there's little to mine.
- New topics you've never published about won't show up, however large the demand.
- Whole missing categories that competitors cover are invisible in your data.
For those, you still need outside sources: industry knowledge, customer questions, sales and support conversations, autocomplete and "People also ask" on the results page, and third-party keyword tools for rough volumes. Use them to find topics you're missing entirely, and use your own data to find where you're already close. The second list is shorter and pays off faster, because Google already shows you to the people searching.
Key takeaways
- Search Console impressions are measured demand for your site and market; volume tools give modelled estimates for everyone.
- Seed from four places: new queries in the compare view, rising queries, question queries and queries that land on the wrong page.
- Expand each seed with a "contains" filter, note the modifiers and group variants that share a results page.
- Impressions approach full demand only on page one; below that, treat them as a floor and estimate clicks with your own CTR curve.
- Each cluster becomes a new page, a new section, an update or a keyword to track, with a success check written down first.
- You can't see queries you don't appear for; use outside sources for topics you've never covered.
Serplyze shows new, growing and rising queries from your own Search Console data, next to the pages that rank for them, and lets you track a whole cluster as one group. Start free and find your next topics in the queries you already have.