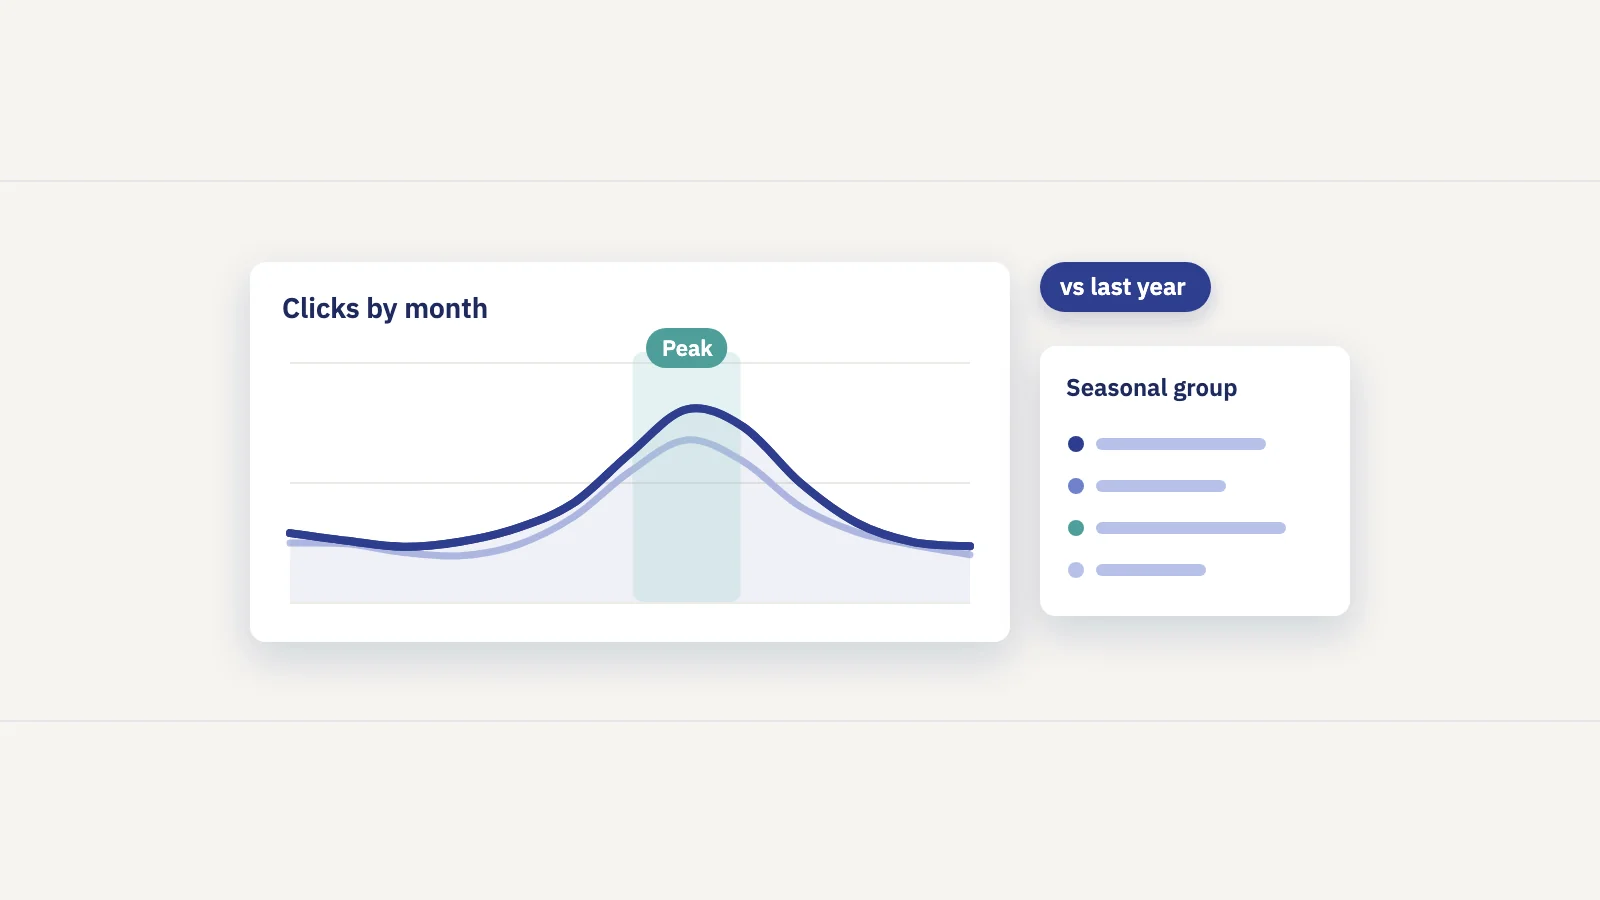
Keyword seasonality is the yearly rise and fall in searches for a keyword: gift queries in December, tax queries before the filing deadline, sunscreen in summer. To track it, you need at least one full year of data per keyword, a monthly view, and a comparison against the same period last year rather than the previous month. Google Search Console gives you all three for up to 16 months; this guide shows how to read them and how to plan content before each peak.
What keyword seasonality is
A seasonal keyword is one whose demand follows the calendar. Your ranking can stay exactly the same while clicks double or halve, because the number of people searching changed. Google's guide to debugging drops in search traffic lists seasonality as one of the normal reasons query demand shifts, and notes that different industries have different levels of it.
Seasonality comes in a few shapes:
| Pattern | Example queries | What it looks like in Search Console |
|---|---|---|
| Fixed-date peak | "christmas gifts for dad", "valentine's day dinner" | Impressions climb for weeks before the date and drop right after it |
| Weather and seasons | "lawn fertilizer", "ski jacket", "air conditioner repair" | A broad hump over several months, shifted by region and hemisphere |
| Cycle-driven | "tax return deadline", "back to school supplies", "open enrollment" | A peak tied to an administrative or school calendar |
| Event-driven | a product launch, a sports tournament, an awards show | A spike in one year that may not repeat |
| Weekly rhythm | business software on weekdays, recipes on weekends | A sawtooth in the daily chart that disappears in a weekly or monthly view |
Only the first three are seasonality in the planning sense: they repeat every year, so you can prepare for them. Event spikes and weekly rhythms still matter, because they distort any comparison that ignores them.
Why you need more than 12 months of data
A single year shows a shape. It can't tell you whether that shape repeats. To call a pattern seasonal, you need to see the same months at least twice, which means more than 12 months of history.
Search Console's Performance report goes back 16 months. That is enough for one full year plus the same few months a year earlier: you can compare the last 3 or 4 months with the same months last year, but not a full year with the year before. Google's debugging guide suggests exactly this check: select the last 16 months to see whether a drop happened at the same point the previous year. For longer history, the same guide points to the Search Analytics API or the bulk data export, which you have to start collecting before you need it.
The practical rule: start storing your Search Console data now if you want to see more than one cycle later.
How to spot seasonality in Search Console
You can check any keyword, page or section in a few minutes.
- Open Performance > Search results and set the date range to the last 16 months.
- Switch the chart to a monthly view. In December 2025 Google added weekly and monthly views to the Performance report; the drop-down above the chart that reads Daily changes it. Monthly totals hide the weekday sawtooth and make the yearly shape easy to see.
- Turn on impressions and clicks. Impressions show demand: how often you appeared. Clicks show what you got from it.
- Filter to one keyword or a group. Add a Query filter for a single keyword, or a regex filter for a family of them. A query filter removes anonymized queries from the totals, so the numbers will be lower than the unfiltered chart.
- Look for a repeating shape. If impressions rise and fall at the same months in both years while average position stays flat, demand is seasonal.
- Compare year over year. Use the Date filter's Compare tab and pick the same months last year. The Queries and Pages tabs then show both periods side by side with the difference.
- Cross-check demand in Google Trends. Google's debugging guide suggests comparing a query's trend in Google Trends to see whether a change is limited to your site or happening across the web. Trends goes back much further than 16 months, so it is the easiest way to confirm a pattern repeats every year.
Read position next to impressions. If impressions fell but position held, demand fell, and no rewrite will bring those searches back before the season returns. If position fell too, something else is going on; our guide to content decay covers how to tell the two apart.
Year over year or previous period?
Most monthly SEO reports compare a month with the month before. For seasonal keywords, that comparison mostly measures the calendar.
| Comparison | Answers | Use it when |
|---|---|---|
| Previous period (this month vs last month) | Did something change in the last few weeks? | Spotting sudden drops, checking a release or a fix |
| Same period last year | Are we doing better than at this point last year? | Seasonal keywords, monthly and quarterly reporting |
| Same period two years ago | Is last year's comparison itself unusual? | Only with more than 16 months of stored data |
Say a gift guide got 4,000 clicks in November and 12,000 in December (example data). Against the previous period it grew 200%, which says nothing about your SEO. Against last December's 10,000 clicks, it grew 20%, which does.
Two adjustments keep year-over-year honest. Compare the same days of the week, since a period shifted by a weekday can move totals on its own. And check for date-moving events: Easter, Black Friday or a school holiday that falls in a different week this year shifts the peak, so compare the whole season, not a single week.
Monthly SEO tracking for seasonal keywords
Seasonality is easier to manage when it is built into how you track and report.
- Group keywords by season. Put "winter", "back to school" or "holiday gifts" keywords in their own groups so the group's total, not single keywords, shows the curve.
- Report monthly, with both comparisons. Show each group against the same month last year and against the previous month, and say which one the headline uses.
- Track position separately from clicks. For seasonal groups, position is the number you control. Clicks follow demand.
- Annotate the calendar. Mark when each season starts, when you updated pages and when a Google update rolled out. Next year's comparison is only readable with that context.
- Watch the off-season too. Rankings for seasonal pages can slip while nobody is searching, and you only notice when the peak comes in lower.
Our SEO report template shows where a seasonal group fits in a monthly report.
Plan content before the peak
Seasonal pages are worth the most during a few weeks a year, and changes need time to be crawled and settle. That sets the order of work:
- List your seasonal keyword groups and the months each one peaks, from last year's Search Console data and Google Trends.
- Find when demand starts to rise, not just when it peaks. Impressions usually climb weeks before the peak date.
- Update existing pages ahead of that rise. Refresh facts, products, prices and dates, fix titles and descriptions, and check internal links from pages that rank year-round.
- Keep one URL per season. Update the same gift guide every year instead of publishing a new URL each time, so the page keeps its history and links.
- Check indexing before the season. Use URL Inspection on the pages that matter so a crawl or indexing problem doesn't surface in the middle of the peak.
- Review after the season. Compare with last year's season, note what changed and set the date for next year's update.
When you forecast, account for the season too. A forecast built on the last few months of a seasonal site will overshoot in the dip or undershoot before the peak. Our guide to SEO forecasting covers baselines that include a yearly pattern.
Tracking seasonality in Serplyze
Serplyze builds on the same Search Console data, so the method above doesn't change; it saves the repeated filtering. Your seasonal keywords go into keyword groups, and the rank tracker shows a group's keywords for any date range with a daily, weekly or monthly interval. Explore pivots tracked keywords by month and compares a period with the previous year or the previous period.
Comparisons default to the same period last year when your data covers it. When it doesn't, Serplyze falls back to the previous period instead of showing an empty change. How far back your data goes depends on your plan: keyword history is backfilled from Search Console when you connect, and the 16-month history add-on keeps the full window Search Console offers, which is what a year-over-year view needs. The forecast also adds a yearly pattern only when it has about a year of data to learn from.
Notes let you mark season starts and page updates on the charts, and scheduled reports compare each period with the previous period or the same period last year. The rank tracking feature page and pricing list what each plan includes.
Frequently asked questions
What is keyword seasonality?
Keyword seasonality is a repeating yearly pattern in how often people search for a keyword. Demand rises and falls in the same months each year, driven by holidays, weather, school or tax calendars. Clicks follow demand even when your ranking doesn't change.
How do I find seasonal keywords for my site?
In Search Console, set the last 16 months, switch the chart to the monthly view and filter by query or page. Keywords whose impressions rise and fall at the same months in both years, with stable position, are seasonal. Confirm with Google Trends, which covers more years.
How much data do I need to track keyword seasonality?
More than 12 months, so you see the same months at least twice. Search Console's 16 months allow one year-over-year comparison of a few months. For several cycles, store the data yourself through the API or the BigQuery bulk export, or use a tool that keeps the history.
Should I compare SEO results month over month or year over year?
For seasonal keywords, year over year: it compares the same season with itself. Month over month is still useful for catching sudden changes, but on a seasonal site it mostly reflects the calendar. Say which comparison a report uses.
When should I publish or update seasonal content?
Before demand starts to rise, not at the peak. Check when impressions began climbing last year and update the page ahead of that, so it is crawled and settled when searches increase. Reuse the same URL each year.
Key takeaways
- Keyword seasonality is a yearly demand pattern; clicks can swing while your ranking stays the same.
- Calling a pattern seasonal needs more than 12 months of data; Search Console's 16 months allow one year-over-year look at a few months.
- Use the monthly chart view, a query or page filter, and Compare with the same period last year; confirm with Google Trends.
- Report seasonal keyword groups against last year, track position separately from clicks, and annotate season starts and updates.
- Update seasonal pages before demand rises, keep one URL per season and review each season against the last.
Serplyze groups your seasonal keywords, compares them with the same period last year when your history reaches it and keeps the notes next to the charts. Start free and set up your first seasonal group.