Core Web Vitals are Google's three measures of how a page loads, responds and holds still for real visitors. The Search Console report tells you which groups of pages fail them; your Performance data tells you which of those groups are worth fixing first.
What are Core Web Vitals?
Core Web Vitals are a subset of Google's web performance metrics, each covering one part of the experience. As of 2024 there are three, defined on web.dev:
- Largest Contentful Paint (LCP): loading. How long until the largest image or text block in the viewport is rendered.
- Interaction to Next Paint (INP): responsiveness. How long the page takes to visually respond after a click, tap or key press, across the visit.
- Cumulative Layout Shift (CLS): visual stability. How much visible content jumps around unexpectedly.
INP replaced First Input Delay (FID) on March 12, 2024. FID only measured the delay before the first interaction was handled; INP looks at the responsiveness of interactions throughout the page's life, which is why pages that passed FID easily can fail INP. If an older guide or audit mentions FID, it's out of date.
The thresholds
Search Console's Core Web Vitals report uses three bands per metric:
| Metric | Good | Needs improvement | Poor |
|---|---|---|---|
| LCP | 2.5 s or less | up to 4 s | over 4 s |
| INP | 200 ms or less | up to 500 ms | over 500 ms |
| CLS | 0.1 or less | up to 0.25 | over 0.25 |
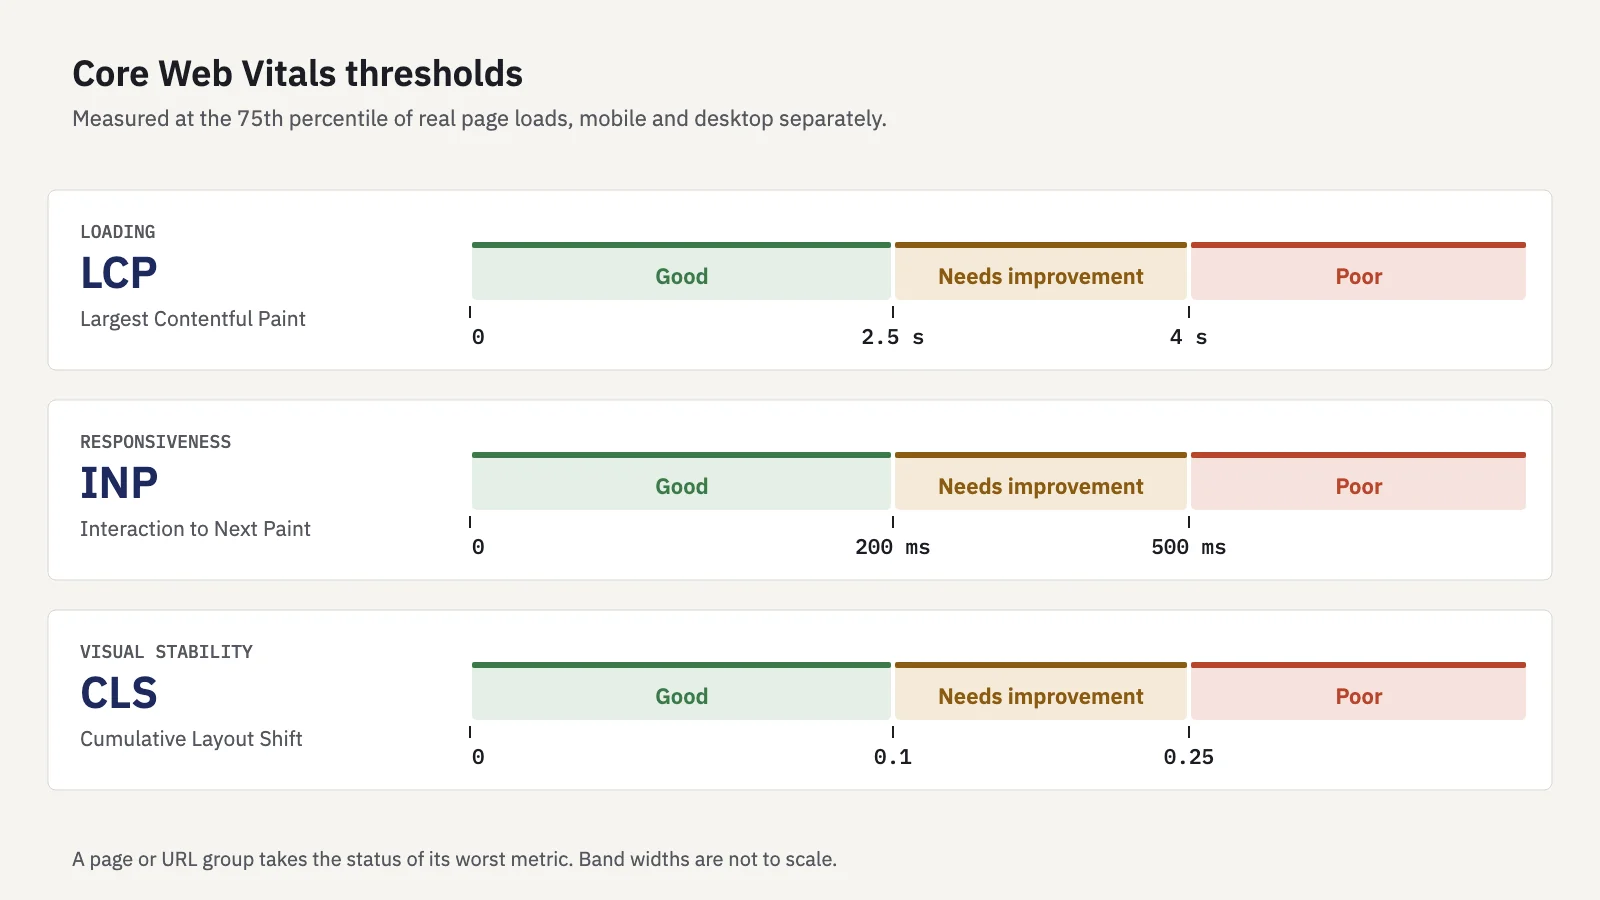
Two rules decide whether a page passes. First, each metric is measured at the 75th percentile of page loads: 75% of visits must meet the threshold, not the average visit. Second, a page or URL group gets the status of its worst metric. Good LCP and CLS with poor INP means the group is Poor. Mobile and desktop are assessed separately, so the same template can be Good on desktop and Poor on mobile.
Field data vs lab data
There are two ways to measure these metrics, and they routinely disagree.
Field data comes from real Chrome users through the Chrome User Experience Report (CrUX). It reflects real devices, networks, caches and behavior, summarized over the last 28 days. Search Console's report and the top section of PageSpeed Insights use field data.
Lab data comes from one simulated page load in a controlled environment, such as Lighthouse in Chrome DevTools. It's repeatable and gives you a waterfall to debug, but it's a single device on a single network. Lighthouse can't measure INP at all, because nobody interacts with the page; it reports Total Blocking Time as a proxy.
Google's guidance on why lab and field data differ is clear about which to trust: field data is what real users experience, so use it to decide where to focus, and use lab data to diagnose and test fixes before you ship them. A green Lighthouse score next to a Poor status in Search Console isn't a contradiction. It usually means real visitors have slower phones, slower connections or heavier interactions than the test.
Field data needs enough traffic. Pages and groups without enough CrUX data don't appear in the report, and a small site may see "No data available" for one device type. In that case lab tools are all you have.
How the Search Console report groups URLs
Open Experience > Core Web Vitals in Search Console. You get a Mobile and a Desktop chart, each counting URLs as Poor, Need improvement or Good. Open a report and the table lists issues, such as an LCP or CLS problem on mobile, with the number of affected URLs.
The detail that matters for prioritising: Search Console doesn't judge URLs one by one. According to Google's documentation:
- URLs with a similar experience are grouped, on the assumption that they share a framework and a common cause. The group's status applies to every URL in it.
- Each group is shown by one example URL. Group members are listed by impressions, highest first.
- Group values are population-level, at the 75th percentile across all the group's page loads.
- Thin data falls back to the origin. If a group doesn't have enough data, Search Console uses data for the whole origin instead.
- Only indexed URLs appear, and data is attached to the actual URL visited, not the canonical, with URL parameters counted as distinct.
- The issue details table shows at most 200 rows. For one specific URL, Google points you to PageSpeed Insights.
So a row reading "LCP issue, 3,400 URLs" is rarely 3,400 problems. It's usually one template, such as product pages or blog articles, with one cause: an unoptimized hero image, a slow server response, a late-loading font. Fix the template and the whole group moves.
Prioritising by template and by traffic
The report tells you what's failing. It doesn't tell you what's worth fixing first. A Poor group of 40 archive pages that get no search traffic is less urgent than a Needs improvement group covering every product page. Combine the report with Performance data:
- List the failing groups by template. For each issue, open the example URLs and name the page type: product, category, article, store locator. Note mobile and desktop separately, and check the Devices tab in Performance to see which carries more of your search traffic. Start with that one.
- Measure each template's search traffic. In Performance > Search results, click + Add filter > Page, choose Custom (regex) and match the template's URL pattern, for example
^https://www\.example\.com/products/. Add a Device filter for Mobile and note clicks for the last 3 months. Repeat for each template. - Place each template on a grid of search traffic against status: Poor, Need improvement, Good.
- Fix high-traffic Poor groups first, then high-traffic Need improvement groups. Low-traffic Poor groups go on the list after that.
- Diagnose with lab tools. Run the example URLs through PageSpeed Insights and Lighthouse to find the cause: the LCP element, long tasks behind INP, elements without reserved space behind CLS.
- Ship the fix at template level, then click Start tracking on the issue in Search Console. Validation watches the field data for 28 days, so allow about a month for the status to change.
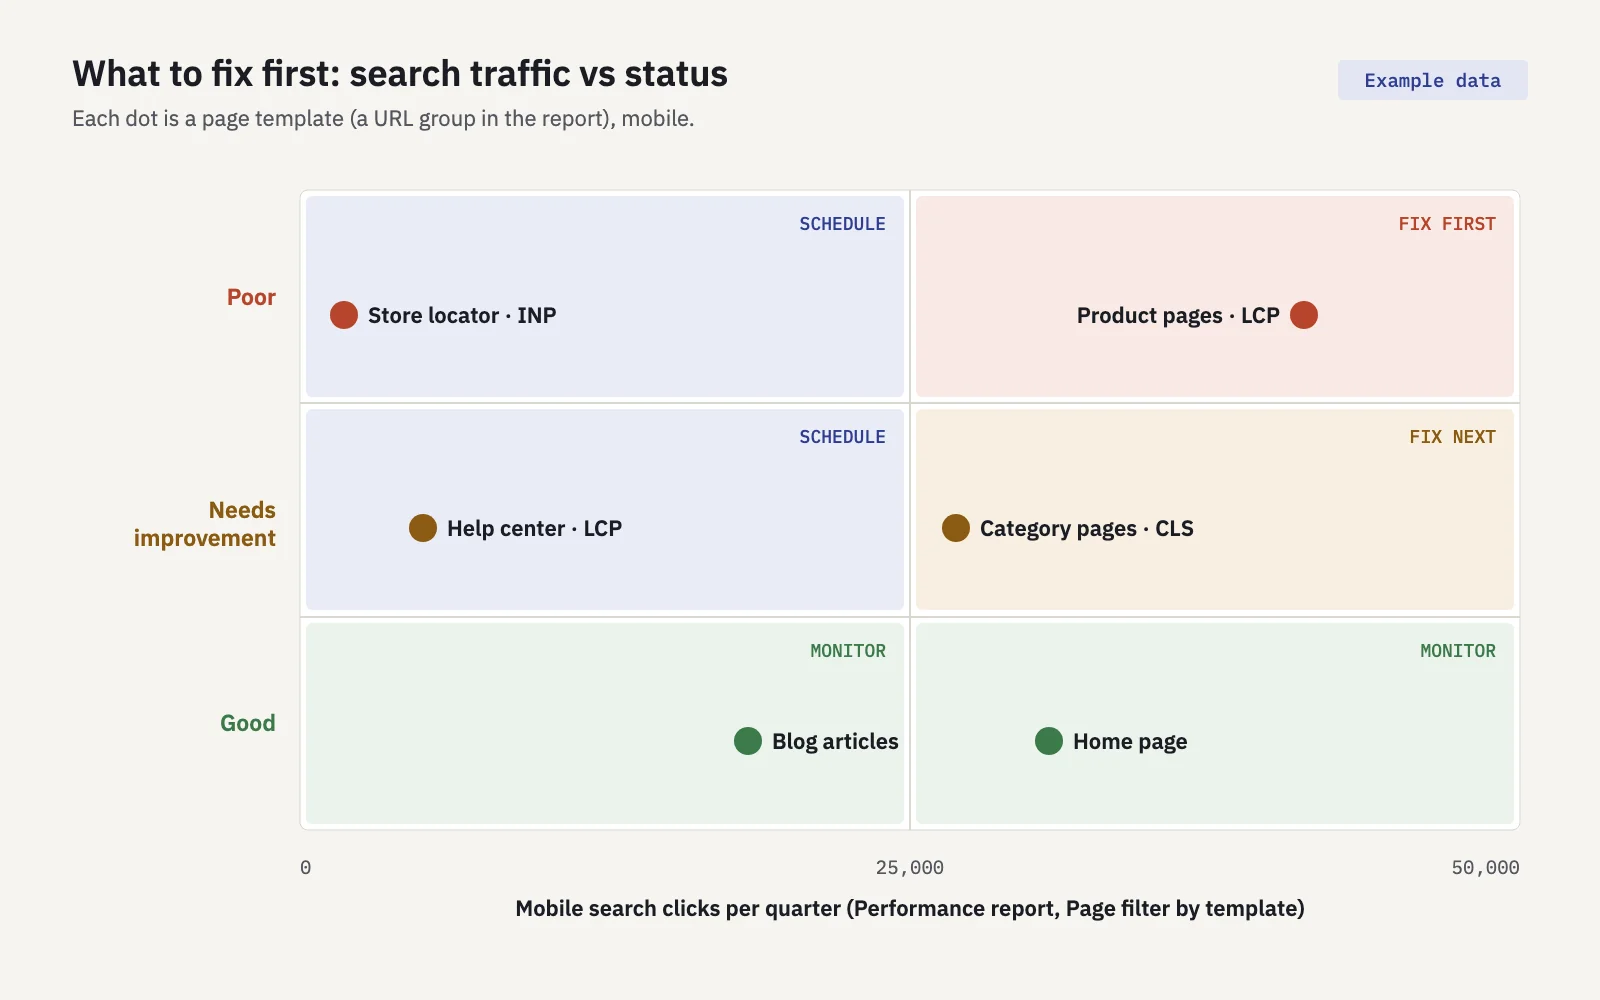
A worked example (illustrative numbers). Say product pages get 42,000 mobile clicks a quarter and are Poor on LCP, blog articles get 18,000 and are Good, category pages get 27,000 and need improvement on CLS, and the store locator gets 600 and is Poor on INP. The order is products, then categories, then the store locator. The blog can wait even though it gets thirty times the store locator's traffic, because it already passes.
| Template | Mobile status | Failing metric | Clicks (example) | Priority |
|---|---|---|---|---|
| Product pages | Poor | LCP | 42,000 | 1 |
| Category pages | Need improvement | CLS | 27,000 | 2 |
| Store locator | Poor | INP | 600 | 3 |
| Blog articles | Good | none | 18,000 | Monitor |
Serplyze has no Core Web Vitals report, but it does make step 2 faster. Under Traffic > Groups, page groups built from URL rules (starts with, contains or a regex on the path) list each template's clicks, impressions and share of site clicks, sorted by clicks. Groups can start from your top folders. The lists cover all devices, so use Search Console's Device filter when you need the mobile split. See the Traffic docs.
What to expect from the ranking impact
Set expectations before you promise anyone a traffic jump. Google's page experience documentation says that "Core Web Vitals are used by our ranking systems", and in the same breath that good results "doesn't guarantee that your pages will rank at the top." Google also says it tries to show the most relevant content even when its page experience is sub-par, and that page experience matters most when there's lots of helpful content available for a query.
In practice:
- Content and relevance come first. Moving a page from Poor to Good won't lift it past a competitor with a clearly better answer.
- Don't chase a perfect score. Google says getting a perfect score just for SEO may not be the best use of your time. Aim for Good on templates that earn traffic, then stop.
- Users notice even when rankings don't move. A page that jumps while loading or ignores a tap costs you the visitor you already won. That alone can justify the fix.
- Measure, don't assume. After a fix validates, compare the template's clicks, CTR and average position over equal periods before and after. If you also changed content or a core update landed, you can't credit the result to speed alone; our guide to core update impact covers separating overlapping changes.
A good routine is to check the Core Web Vitals report monthly as part of your SEO monitoring, and after every release that touches templates, scripts or images. A new third-party script, a heavier hero image or a late-loading banner can push a passing template back to Poor.
Key takeaways
- The three Core Web Vitals are LCP (good at 2.5 s or less), INP (200 ms or less) and CLS (0.1 or less). INP replaced FID in March 2024.
- Status is set at the 75th percentile of real visits, by the worst of the three metrics, separately for mobile and desktop.
- Search Console groups similar URLs. Each failing group is usually one template with one cause.
- Rank failing templates by their search clicks and fix high-traffic Poor groups first. Use lab tools to diagnose and field data to confirm.
- Core Web Vitals are a ranking factor, not a shortcut past relevance. Fix what earns traffic, reach Good, then move on.
Serplyze shows your Search Console clicks by page group, so you can see which templates carry your traffic before deciding what to speed up. Start free and connect your property in a couple of minutes.